Ciencias Psicológicas; v19(2)
julio-diciembre 2025
10.22235/cp.v19i2.4401
Artículos Originales
Bienestar subjetivo de estudiantes y docentes de Uruguay: satisfacción con la vida, perfiles afectivos y emociones académicas
Subjective Well-Being of Students and Teachers in Uruguay: Life Satisfaction, Affective Profiles and Academic Emotions
Bem-estar subjetivo de estudantes e docentes no Uruguai: satisfação com a vida, perfis afetivos e emoções acadêmicas
Nigel Manchini1, ORCID 0000-0002-1221-9259
Daniel Trías Seferian2, ORCID 0000-0003-1274-9134
Óliver Jiménez3, ORCID 0000-0003-0314-8396
Natalia Ramos-Díaz4, ORCID 0000-0003-4269-8948
1 Universidad de Málaga, España, [email protected]
2 Universidad Católica del Uruguay, Uruguay
3 Universidad de Málaga, España
4 Universidad de Málaga, España
Resumen:
Aunque el afecto y el bienestar ocupan un lugar central en el discurso educativo, los recursos y la evidencia son todavía escasos. Este trabajo buscó analizar propiedades psicométricas de instrumentos breves, identificar perfiles afectivos y explorar las emociones que el estudiantado asocia a su institución. Participaron docentes (n = 350), estudiantes de educación media básica (n = 357) y media superior (n = 375) de Uruguay, quienes cumplimentaron escalas de bienestar subjetivo (SWLS y PANAS) y una pregunta abierta procesada mediante análisis automatizado de textos. Los análisis factoriales, de fiabilidad y de correlación sugieren la validez de ambas escalas, mientras que los análisis de conglomerados sugieren la existencia de cuatro perfiles afectivos asimilables al modelo de Norlander et al. (2002): autorrealizado, autodestructivo, alta-afectividad y baja-afectividad. Aunque la institución educativa es asociada predominantemente a experiencias desagradables (como estrés, cansancio, tristeza y ansiedad) también se la asocia con alegría y felicidad. Se identificaron diferencias dependiendo del perfil afectivo: por ejemplo, las asociaciones con interés, motivación y curiosidad son distintivas del perfil autorrealizado, mientras que decepción, desagrado y soledad lo son del autodestructivo. Los resultados sugieren que la conjunción de escalas y análisis de texto permite obtener insights sobre el bienestar en contextos educativos.
Palabras clave: bienestar; afectividad; enseñanza secundaria; evaluación psicológica; adolescentes.
Abstract:
Although affect and well-being occupy a central place in educational discourse, resources and evidence are still scarce. This study sought to analyze the psychometric properties of brief instruments, identify affective profiles and explore the emotions that students associate with their institution. The participants were teachers (n = 350), middle school students (n = 357) and high school students (n = 375) from Uruguay, who completed subjective well-being scales (SWLS and PANAS) and an open-ended question processed through automated text analysis. Factor, reliability and correlation analyses suggest the validity of both scales; cluster analysis suggests the existence of four affective profiles similar to Norlander et al.'s (2002) model: self-fulfilling, self-destructive, high-affective and low-affective. Although the educational institution is predominantly associated with unpleasant experiences (such as stress, tiredness, sadness and anxiety), it is also associated with joy and happiness. Differences were identified depending on the affective profile: for example, associations with interest, motivation and curiosity are distinctive of the self-fulfilling profile, while disappointment, displeasure and loneliness are distinctive of the self-destructive profile. The results suggest that the conjunction of scales and text analysis allows for insights into well-being in educational contexts.
Keywords: well-being; affectivity; secondary education; psychological assessment; adolescents.
Resumo:
Embora o afeto e o bem-estar ocupem um lugar central no discurso educacional, os recursos e as evidências ainda são escassos. Este estudo buscou analisar propriedades psicométricas de instrumentos breves, identificar perfis afetivos e explorar as emoções que os estudantes associam à sua instituição. Participaram docentes (n = 350) e estudantes de ensino fundamental 2 (n = 357) e ensino médio (n = 375) do Uruguai, que responderam a escalas de bem-estar subjetivo (SWLS e PANAS) e a uma pergunta aberta processada por meio de análise de texto automatizada. As análises fatoriais, de confiabilidade e de correlação sugerem a validade de ambas as escalas, enquanto as análises de conglomerados indicam a existência de quatro perfis afetivos semelhantes ao modelo de Norlander et al. (2002): autorrealizado, autodestrutivo, alta afetividade e baixa afetividade. Embora a instituição educacional esteja predominantemente associada a experiências desagradáveis (como estresse, cansaço, tristeza e ansiedade), também é associada à alegria e felicidade. Foram identificadas diferenças dependendo do perfil afetivo: por exemplo, as associações com interesse, motivação e curiosidade são características do perfil autorrealizado, enquanto decepção, desagrado e solidão são típicos do perfil autodestrutivo. Os resultados sugerem que a combinação de escalas e análise de texto permite obter insights sobre o bem-estar em contextos educacionais.
Palavras-chave: bem-estar; afetividade; ensino médio; avaliação psicológica; adolescentes.
Recibido: 10/12/2024
Aceptado: 22/05/2025
El foco en el bienestar emocional parece ser parte de un ethos epocal con profusas manifestaciones tanto en contextos educativos y académicos como en la agenda de políticas públicas (Curren et al., 2024; Palacios-Díaz et al., 2023; Organización Mundial de la Salud & Fondo de las Naciones Unidas para la Infancia, 2021; Rivera-Vargas & Oyanedel, 2023). Florecen, consecuentemente, propuestas que —con distintos enfoques y objetivos— buscan abordar los afectos en el ámbito escolar. Esta tendencia, potenciada desde la pandemia del COVID-19 (Anselmi et al., 2024; Carrizo, 2021), dista de ser un fenómeno sencillo de evaluar: discutir el afecto y el bienestar en la educación implica abordar problemas técnicos, pero también filosóficos y ético-políticos (Palacios-Díaz et al., 2023).
En este contexto, parece imprescindible disponer de evidencia y de recursos para atender al bienestar de manera sistemática y no reduccionista, analizar sus dinámicas y proyectar acciones profesionales, institucionales y sociales. Atendiendo esa necesidad, este trabajo analiza el funcionamiento de dos instrumentos breves para evaluar el bienestar de estudiantes y docentes, valida un modelo de perfiles afectivos con foco en la persona y realiza el análisis de respuestas abiertas del estudiantado al respecto de las emociones asociadas a la institución educativa, tendiendo un puente entre los resultados cuantitativos y las palabras utilizadas cotidianamente.
El bienestar subjetivo como operacionalización de la felicidad
En consonancia con la diversidad de campos semánticos asociados a la felicidad, la vida buena y el bienestar, se han propuesto multiplicidad de marcos conceptuales y metodológicos para su abordaje filosófico y empírico (Brown & Potter, 2024). Este trabajo operacionaliza el bienestar desde una concepción hedonista (Ryan & Deci, 2001), poniendo el foco en el placer, la satisfacción y la experiencia afectiva (Crisp, 2017). Por su simplicidad y operacionalizabilidad, este enfoque ha podido dar una imagen general del bienestar a nivel individual y colectivo (Diener et al., 2017; Gallup, 2024; Rowan, 2022). Sin embargo, la parsimonia que le da su potencia también impone sus límites: al reducir el bienestar a su dimensión afectiva y a juicios de satisfacción, estos enfoques no son capaces de ver —y quizás invisibilizan— otras dimensiones relevantes de la vida buena (Ahmed, 2021; Camps, 2019), como la autonomía, la autoaceptación, las relaciones positivas o el propósito de vida (Dávila et al., 2024). Este trabajo, por lo tanto, no aborda la felicidad, sino una operacionalización: el bienestar subjetivo.
Bienestar subjetivo y perfiles afectivos
El modelo propuesto por Diener (1994) identifica tres componentes del bienestar subjetivo (BS): satisfacción con la vida (SV), afecto positivo (AP) y afecto negativo (AN).
La SV, el componente cognitivo, refiere al juicio general que la persona hace sobre su vida: una “evaluación global de la calidad de vida de una persona de acuerdo con los criterios elegidos por ella misma” (Diener, 1994, p. 69). Aunque ese juicio puede verse afectado por aspectos emocionales, no es una medida afectiva, sino el resultado de un proceso cognitivo de comparación entre la percepción consciente que la persona tiene de sus circunstancias de vida y sus propios estándares, explícitos o implícitos (Pavot & Diener, 2008).
El componente afectivo, dado por el AP y el AN, refiere a la experiencia emocional placentera y displacentera. Aunque afecto es un término teóricamente problemático (Feldman-Barrett & Bliss-Moreu, 2009), una definición genérica, como la adoptada por García (2023), capta el uso del término en el campo del BS: la experiencia consciente de sentimientos (feelings) derivados de respuestas automáticas del sistema nervioso ante estímulos internos y externos, y —más en general— los sentimientos (feelings) que se tiende a experimentar cotidianamente y que dan color a la experiencia (García, 2023). Una de las características nucleares del afecto es la valencia o tono hedónico de la experiencia, referida a la cualidad de agradabilidad/desagradabilidad, susceptible a la introspección (Feldman-Barrett & Bliss-Moreu, 2009). Teniendo en cuenta la evidencia de estudios psicométricos y consideraciones teóricas (Diener, 1994; Diener et al., 2017), AP y AN son conceptualizados y evaluados como dos variables independientes (en contraste con, por ejemplo, Feldman-Barrett & Bliss-Moreu, 2009). Los antecedentes (e.g., Caicedo et al., 2018; Flores-Kanter & Medrano, 2016, 2018; Santágelo et al., 2019) son consistentes respecto de que AN y AP no se encuentran fuerte y negativamente relacionados (y, por lo tanto, no se trataría de dos polos de una dimensión), aunque la evidencia sugiere que tampoco serían completamente independientes. En ese sentido, García (2023) ha propuesto que la afectividad constituye un meta-sistema dinámico y adaptativo con AN y AP como dos subsistemas independientes a nivel bajo, pero interrelacionados a nivel alto.
Considerando esta relativa independencia de AP y AN, Norlander et al. (2002) propusieron un modelo (posteriormente llamado modelo de los perfiles afectivos) que identifica y nombra cuatro posibles combinaciones de alto/bajo AN y AP (Figura 1): un perfil autorrealizado (SF, Self-Fulfilling), un perfil auto-destructivo (SD, Self-Destructive), y perfiles de alta y baja afectividad (HA y LA, High/Low Affective).
Figura 1: Cuatro perfiles afectivos
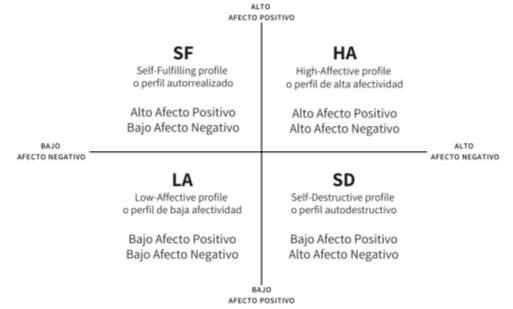
Nota: Elaboración propia a partir de García (2023).
Los hallazgos acerca de las características de estos perfiles sugieren consistentemente diferencias en SV y otros indicadores de bienestar, como autonomía, autoaceptación, etc. (García, 2023; Sagone & De Caroli, 2023), así como en variables vinculadas a la educación, como la procrastinación y las calificaciones (Sagone et al., 2023). Si bien en el Río de la Plata existe un claro interés en indagar en estas variables afectivas (Caicedo et al., 2018; Flores-Kanter & Medrano, 2018; Santágelo et al., 2019) y existe abundante literatura sobre perfiles afectivos, producida especialmente en Europa (García, 2023), los estudios sobre este modelo en la región son escasos (cf. Brunet et al., 2024).
El presente estudio: bienestar en contextos educativos
En el contexto de la educación uruguaya, atender variables afectivas es relevante no solo por su relación con la motivación y la autorregulación del aprendizaje (Chiarino et al., 2024; Huertas, 2012) y otras variables académicas de interés (Cunsolo, 2017; Unicef, 2022), sino también porque la situación al respecto dista de ser ideal (Carrizo, 2021; Instituto Nacional de Evaluación Educativa (Ineed), 2020, 2023a). Aunque las cifras de bienestar en Uruguay son comparables a las de otros países (Fernández et al., 2024; Gallup, 2024), una preocupante proporción de adolescentes y jóvenes reportan haber intentado (1.2 %) o considerado (3.3 %) autoeliminarse; 14.4 % dice haberse sentido tan triste o desesperado que dejó de hacer sus actividades habituales por dos o más semanas (Unicef, 2022). En este sentido, la prevalencia de conductas de riesgo en esta población parece haber aumentado a lo largo de la última década (Ineed, 2023b; Unicef, 2022). En el caso del cuerpo docente, el 26 % puede considerarse con bajo bienestar cuando se consideran tanto factores positivos (como la motivación y el entusiasmo) como sus síntomas de estrés y burnout (Ineed, 2020); lo cual resulta problemático tanto en sí mismo como por sus consecuencias sobre otras variables (Mels et al., 2024). En el contexto latinoamericano (Bravo-Sanzana et al. 2025; Dávila et al., 2024) y uruguayo, donde claramente existe interés en la evaluación del bienestar de docentes (Ineed, 2020; Mels et al., 2024) y adolescentes (García-Álvarez et al., 2020; Ineed, 2023b; Portela, 2021), resulta llamativo que las escalas más frecuentemente utilizadas para evaluar el bienestar hedónico (Fernandes & Araujo, 2018) no se encuentren validadas en contextos educativos. Este estudio se orienta a ese objetivo.
Al poner el foco en los contextos educativos, parece necesario complementar las evaluaciones generales con medidas situadas (Dávila et al., 2024; Fernandes & Araujo, 2018) y producir información que sea relevante y comprensible para los agentes involucrados (Zenteno-Osorio & Leal-Soto, 2023). En esa línea, este trabajo complementa el análisis de escalas de BS con la exploración de una variable afectiva situada en el contexto educativo —las emociones académicas—, utilizando un enfoque fácilmente interpretable: el análisis automatizado de las palabras utilizadas por el estudiantado en respuestas abiertas.
Las emociones académicas (EA) se definen como aquellas experimentadas por el estudiantado en entornos académicos, tanto las asociadas a los resultados y procesos de aprendizaje (Pekrun et al., 2023) como al vínculo con el profesorado (Lei et al., 2018). Además de su valor intrínseco asociado al bienestar (Stockinger et al., 2025), también se ha documentado su relación con el aprendizaje (Tan et al., 2021), el rendimiento académico (Camacho et al., 2021), la motivación y la autorregulación (Pekrun et al., 2023), entre otras variables de interés.
Aunque se han utilizado otros abordajes, la escala retrospectiva de autorreporte es el tipo de instrumento más frecuentemente utilizado para la evaluación del BS y las EA (Diener et al., 2017; Pekrun, 2016). Dado el carácter subjetivo y consciente del bienestar (Diener, 1994; García, 2023), parece que el sujeto se encontraría en una posición privilegiada para reportarlo (cf., Ahmed, 2021; Ogden & Lo, 2011). Aun aceptando esa premisa, las limitaciones inherentes a la escala tipo Likert hacen deseable complementar este tipo de medida (Ogden & Lo, 2011). Se ha vuelto habitual, en ese sentido, utilizar herramientas computacionales para cuantificar dimensiones afectivas en datos textuales, utilizando el lenguaje como una ventana a la experiencia (Boyd & Schwartz, 2021; Vine et al., 2020). Este enfoque ha sido utilizado en educación (Papamitsiou & Economides, 2014; Zhou & Ye, 2020) y en el estudio del bienestar (García et al., 2019; García & Sikström, 2023). Sin embargo, su implementación en entornos educativos hispanohablantes ha sido limitada (Manchini, Jiménez et al., 2024).
En este contexto, este estudio se propone analizar el BS y las EA en docentes y estudiantes uruguayos de educación secundaria. Concretamente se propone: (1) analizar las propiedades psicométricas de dos escalas de BS con docentes y estudiantes uruguayos de educación secundaria, (2) identificar perfiles afectivos de estudiantes y docentes, y (3) explorar las EA que los adolescentes asocian al liceo considerando los distintos perfiles afectivos.
Método
Participantes
La muestra se conformó por 357 estudiantes de educación media básica (EMB; Medad = 13.6, DE = 0.76; 54.6 % mujeres), 375 estudiantes de educación media superior (EMS; Medad = 16.5, DE = 0.78; 61 % mujeres), y 350 docentes (Medad= 36.3, DE = 12.4; 76.2 % mujeres) de Uruguay. Los estudiantes pertenecían a instituciones públicas del departamento de Colonia. El 95.3 % de los docentes se desempeñaba en educación pública en múltiples instituciones y niveles. Considerando la diversidad de centros y niveles en los que se desempeña el cuerpo docente en el contexto uruguayo, y la consecuente diversidad de asociaciones emocionales, en esta muestra no se exploraron las emociones académicas. El muestreo intencional se basó en la accesibilidad a las instituciones y la disponibilidad de los participantes para formar parte del estudio.
Instrumentos
Satisfaction with Life Scale (SWLS). Esta escala unidimensional mide la satisfacción con la vida (SV) incluyendo cinco ítems que presentan afirmaciones con la cual debe expresarse el acuerdo/desacuerdo (ej., Estoy satisfecho/a con mi vida). La puntuación de cada ítem varía del 1 al 7, siendo la puntuación total mínima de 5 y la máxima de 35. La versión original fue publicada por Diener et al. (1985) y se ha usado en un amplio rango de edades y poblaciones (Pavot & Diener, 2008). Se utilizó la versión adaptada al español rioplatense por Mikulic et al. (2019), con una fiabilidad de α = .81 en su estudio.
Positive and Negative Affect Schedule (PANAS, versión breve). Esta escala bidimensional está diseñada para medir de forma independiente el afecto negativo (AN) y el afecto positivo (AP). La versión original en inglés (Watson et al., 1988) fue adaptada y validada para la variante rioplatense del español (Medrano et al., 2015). La versión breve (Flores-Kanter & Medrano, 2018) está compuesta por 10 ítems presentados como adjetivos que describen emociones (AN: afligido, culpable, asustado, nervioso, temeroso; AP: interesado, entusiasmado, inspirado, decidido, activo), que se puntúan de acuerdo a la frecuencia en que el sujeto se siente así, en una escala Likert de 5 puntos. Se optó por la versión breve debido a su comprobada validez en contextos educativos y su eficiencia para estudios de gran tamaño muestral (Flores-Kanter & Medrano, 2018). En investigaciones previas la fiabilidad de las subescalas en población rioplatense varía entre α = .75 a α = .85 (Flores-Kanter & Medrano, 2018; Santángelo et al., 2019).
Una pregunta abierta sobre emociones académicas (EA), redactada en español rioplatense: Pensando en el último semestre, ¿qué emociones y estados de ánimo asociás específicamente al liceo? Enumerá al menos seis, separando con comas. Escribí el máximo que puedas. Se utiliza para recoger vocabulario emocional relacionado a la institución educativa; por los motivos antes señalados, esta pregunta sólo se incluyó en el caso del estudiantado.
Procedimiento
Los participantes fueron invitados mediante medios institucionales (correo electrónico, grupos internos, plataformas educativas, invitación en aulas y afiches) y redes sociales (para el caso de docentes) a responder un cuestionario online autoadministrado, utilizando sus propios dispositivos. Todos dieron su consentimiento informado, en el caso de los menores de edad, también se solicitó a la institución y a adultos responsables. El contacto con el estudiantado estuvo mediado por la institución, y en ningún caso se recolectaron datos que permitieran la identificación de sujetos. A cambio de su participación, las instituciones obtuvieron un reporte general sobre el bienestar de su estudiantado. Los procedimientos y protocolos fueron aprobados por el Comité de Ética de la Universidad de Málaga, número de registro 152-2022-H.
Análisis de datos
Los datos fueron explorados mediante estadísticos descriptivos, métodos gráficos y la prueba Kolmogorov-Smirnov (K-S). Considerando estas exploraciones, se utilizaron pruebas no-paramétricas y estimadores robustos. Para evaluar las propiedades psicométricas de las escalas, se realizó un análisis factorial confirmatorio (AFC) para cada muestra, utilizando los modelos validados por Mikulic et al. (2019) y Flores-Kanter y Medrano (2018). Considerando la naturaleza ordinal de los datos, su distribución no normal (Li, 2016; Tarka, 2017) y los antecedentes de Caicedo et al. (2018), Santágelo et al. (2019) y Melo et al. (2023), se utilizó el estimador DWLS (Diagonally Weighted Least Squares) en su variante robusta WLSMV (Weighted Least Squares Means and Variance adjusted), con CFI (Comparative Fit Index), TLI (Tucker Lewis Index), RMSEA (Root Mean Square Error of Approximation), y SRMR (Standardized Root Mean Square Residual) como medidas de ajuste (Rosseel, 2012). La interpretación se hizo siguiendo los criterios propuestos por Hu y Bentler (1999): RMSEA y SRMR < .08 aceptable, < .05 excelente; CFI y TLI > .90 aceptable, > .95 excelente. Se calcularon los coeficientes alpha de Cronbach (α) y omega de McDonald (ω) y se determinaron las correlaciones entre las escalas (rho de Spearman).
Para determinar los perfiles afectivos, se realizó un análisis de conglomerados no jerárquico (k-means) con k = 4, siguiendo el modelo propuesto originalmente por Norlander et al. (2002) y las consideraciones metodológicas de García y MacDonald (2023). Para examinar la validez de los perfiles, se exploró la convergencia con un método simple pero empírica y teóricamente robusto —median-splits— (García & MacDonald, 2023), comparando la homogeneidad intra-grupo mediante el valor de WSS (Within-Cluster Sum of Squared Errors). Se realizaron pruebas Kruskal-Wallis para determinar la existencia de diferencias entre los perfiles en AP, AN y SV consistentes con la literatura y la teoría, utilizando η2 como medida del tamaño del efecto (Tomczak & Tomczak, 2014) y con comparaciones por pares realizadas utilizando el test de Dunn con corrección Bonferroni (Ogle et al., 2023).
Los análisis precedentes fueron realizados para todas las muestras (EMB, EMS y docentes), mientras que los que se describen a continuación fueron realizados únicamente con las muestras de EMB y EMS, para las que se disponía de una pregunta abierta referente a EA. Para analizar la relación entre las EA y las variables de BS, se procesaron las respuestas abiertas desde un enfoque basado en diccionarios (Boyd & Schwartz, 2021). Para el preprocesamiento se utilizaron los procedimientos de Silge y Robinson (2016). Para eliminar palabras de categorías gramaticales no deseadas —conjunciones, artículos, pronombres, etc.— se utilizaron los inventarios para Uruguay de CORPES XXI (Real Academia Española, s.f.) y la lista de stopwords en español de Feinerer et al. (2008). Se utilizó el Diccionario Anotado de Vocabulario Emocional (DAVE) (Manchini, Jiménez et al., 2024) para computar la proporción de palabras con valencia positiva, negativa y neutra-ambivalente. Como el estudiantado únicamente contestó utilizando vocabulario emocional explícito, la proporción de positivas/negativas/neutras-ambivalentes se encuentra directamente relacionada; en aras de la simplicidad, se utilizó únicamente la proporción de negativas para calcular la correlación con SV, AN y AP. El vocabulario distintivo de cada uno de los perfiles de estudiantes se exploró utilizando el estadístico Term Frequency - Inverse Document Frequency (TF-IDF) (Silge & Robinson, 2016) y se representó gráficamente mediante nubes de palabras. Estos análisis se realizaron utilizando los procedimientos desarrollados en R (R Core Team, 2021) por Revelle (2022), Rosseel (2012), Silge y Robinson (2016) y Wickham et al. (2019).
Resultados
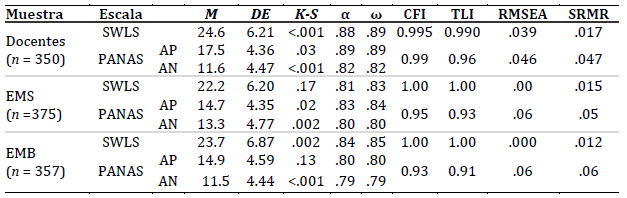
Como se observa en la Tabla 1, las escalas mostraron valores aceptables de α y ω, y un ajuste excelente de SV para las tres muestras, similar a lo reportado por Mikulic et al. (2019), Ruiz et al. (2019) y Melo et al. (2023). En el caso de PANAS, el ajuste del modelo es excelente para docentes y aceptable para estudiantes de EMS y EMB.
El análisis de correlación mostró una relación débil pero significativa y positiva (rho = .11, p = .033) entre AN y AP en la muestra de EMB. No fue significativa en la muestra de estudiantes de EMS (rho = .01, p = .9) ni en la de docentes (rho = .09, p = .08). La correlación con SV fue positiva y moderada para AP en la muestra de docentes (rho = .3, p < .001), de estudiantes de EMS (rho = .36, p < .001) y de EMB (rho = .31, p < .001); mientras que fue negativa y moderada para AN en la muestra de docentes (rho = -.41, p < .001), estudiantes de EMS (rho = -.34, p < .001) y de estudiantes de EMB (rho = -.26, p < .001).
Tabla 1: Estadísticos descriptivos y propiedades psicométricas de las escalas
En las tres muestras (Tabla 2), el análisis de cluster produjo perfiles asimilables al modelo propuesto (García, 2023). Para explorar estos perfiles y su relación con el método split-medians —utilizar la mediana como punto de corte (García & MacDonald, 2023)—, se realizó una matriz de confusión entre ambos enfoques, se hicieron exploraciones gráficas y se calculó el porcentaje de acuerdo. Los resultados cuantitativos y la exploración gráfica sugieren que los perfiles producidos por uno y otro método son equivalentes, con un alto porcentaje de acuerdo (78 % en EMB, 88.5 % en EMS y 78 % en docentes); el cálculo de la WSS para ambos métodos sugiere que los perfiles generados con k-means son más homogéneos, tanto para la muestra de EMB (WSSk-means= 4657.3 , WSSmedian-split= 5168.7) como para la de EMS (WSSk-means = 4737.1, WSSmedian-split= 5015.7) y de docentes (WSSk-means = 4141.9, WSSmedian-split= 4446.4).
Tabla 2: Estadísticas descriptivas de los perfiles afectivos y comparación por pares en SV
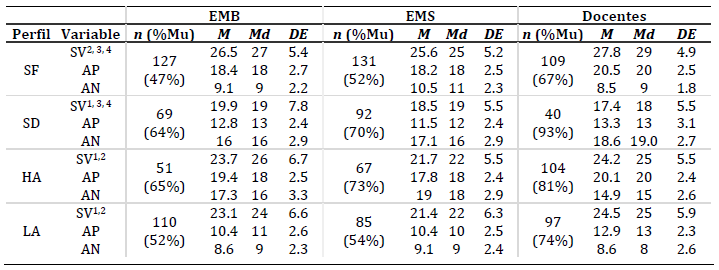
Notas: SF: Self-Fulfilling (autorrealizado); SD: Self-Destructive (autodestructivo); HA: High-Affective (alta afectividad); LA: Low-Affective (baja afectividad). 1 Diferencia significativa con SF (p < .05 en test de Dunn, corr. Bonferroni). 2 Diferencia significativa con SD. 3 Diferencia significativa con HA. 4Diferencia significativa con LA (p < .05 en test de Dunn, corr. Bonferroni). % Mu: Porcentaje de Mujeres.
Al respecto de las diferencias en AN y AP según perfil afectivo, la prueba Kruskal-Wallis indicó la existencia de diferencias significativas en el puntaje de AP entre los perfiles en la muestra de EMB (χ²(gl=3) = 269.25, p < .001, η2 = 0.75), EMS (χ²(gl=3) = 279.22, p < .001, η2 = 0.74) y docentes (χ²(gl = 3) = 242.36, p < .001, η2 = 0.69). Los resultados de AN para EMB (χ²(gl=3) = 235.49, p < .001, η2 = 0.66), EMS (χ²(gl=3) = 277.43, p < .001, η2 = 0.74) y docentes (χ²(gl=3) = 253.12, p < .001, η2 = 0.72) también fueron significativos.
Los resultados sugieren la existencia de diferencias significativas en el puntaje en SV entre los perfiles para EMB (χ²(gl= 3) = 39.12, p < .001, η2 = 0.1), EMS (χ²(gl= 3) = 73.77, p < .001, η2 = 0.19) y docentes (χ²(gl= 3) = 75.36, p < .001, η2 = 0.21). En todas las muestras, los resultados de la comparación por pares (Tabla 2) sugieren la existencia de diferencias significativas en SV entre todos los perfiles excepto entre LA y HA.
Tras el preprocesamiento, el DAVE fue capaz de identificar 2906 (91 %) de las 3201 palabras escritas por el estudiantado en relación a su institución educativa, 1291 en la muestra de EMB y 1615 en la de EMS. Se exploraron manualmente las palabras no captadas (295), confirmando que en general se trata de casos en los que el estudiantado narró motivos de sus asociaciones (“liceo”, “deberes”, “compañeros”, etc.), adverbios (“no”, “muy”), y, en algunos casos, errores de ortografía no captados por el DAVE (“felis”, “juzgación”, “triztesa”, “alegradusimo”, “afrijido”) o términos no considerados como vocabulario emocional (“sueño”). Estos resultados son relevantes para considerar el ruido inherente al abordaje cuantitativo de textos (Boyd & Schwartz, 2021). Sin embargo, como se muestra en la Tabla 3, en ambas muestras una proporción reducida de familias léxicas da cuenta de una proporción muy amplia de las palabras utilizadas por el estudiantado, lo que sugiere que estos casos tendrían una influencia mínima.
Tabla 3: Emociones académicas más frecuentemente reportadas
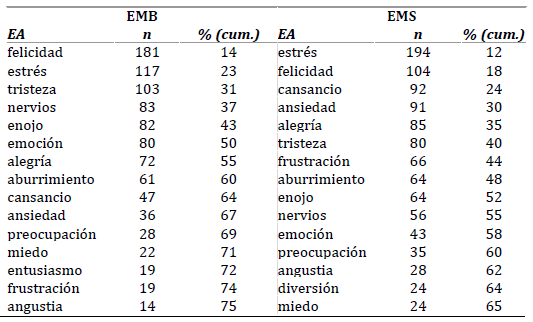
Nota: EA: Emociones Académicas reportadas, normalizadas con DAVE. n: estudiantes que reportan. % (cum.): porcentaje acumulativo de la totalidad de las palabras captadas.
Es de notar que la proporción representada por las 15 palabras más frecuentes es menor en la muestra de EMS, lo cual sugiere el uso de un vocabulario más amplio. Se aprecia que en ambas muestras es mayor la proporción de EA con polaridad negativa: en el caso de EMB, el 53.1 % son negativas, el 8.1 % neutras-ambivalentes y el 38.8 % positivas, mientras que en el de EMS el 65.8 % son negativas, el 5.7 % neutras-ambivalentes y el 28.3 % positivas.
El análisis correlacional sugiere que la proporción de términos negativos se correlaciona significativamente con AN, AP y SV, tanto para EMS como para EMB. En EMS, la proporción de negativas mostró correlaciones positivas con AN (rho = .211, p < .001) y negativas con AP (rho = -.238, p < .001) y SV (rho = -.257, p < .001). La muestra de EMB mostró resultados similares: la proporción de negativas correlacionó positivamente con AN (rho = .212, p < .001) y negativamente con AP (rho = -.220, p < .001) y SV (rho = -.288, p < .001).
El análisis del vocabulario distintivo sugiere la existencia de asociaciones afectivas específicas de cada uno de los perfiles (Figura 2). Las palabras con mayor TF-IDF (valores exactos entre paréntesis) para cada uno de los perfiles fueron:
-Perfil SF: para la muestra de EMS, “interés” (.029), “motivación” (.026), “tranquilidad” (.021) y “empatía” (.018); para la de EMB, “curiosidad” (.016), “contento” (.010), “creatividad” (.010) y “satisfacción” (.010).
-Perfil SD: para la muestra de EMS, “soledad” (.034), “desesperación” (.021), “presión” (.019) y “confusión” (.017); para la de EMB, “decepción” (.020), “desagrado” (.020), “desinterés” (.020) y “mal” (.020).
-Perfil LA: para la muestra de EMS, “fiaca” (.039), “agobio” (.019), “orgullo” (.013), “pereza” (.013); para la de EMB, “tranquilidad” (.018), “presión” (.014), “soledad” (.014) y “bien” (.012).
-Perfil HA: para la muestra de EMS, “impotencia” (.027), “desorientación” (.022), “presión” (.019) y “agotamiento” (.017); para la de EMB, “confusión” (.028), “inseguridad” (.021), “interés” (.021) y “pereza” (.021).
Figura 2: Emociones académicas distintivas de cada perfil afectivo en muestra de EMB (izq.) y EMS (der.)
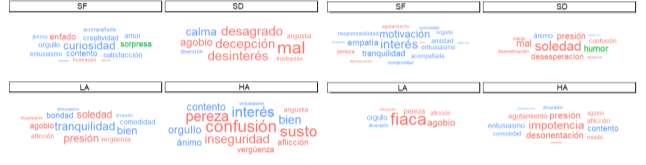
Nota: El tamaño indica el valor de TF-IDF; el color, la polaridad en el DAVE: negativa (rojo), positiva (azul) o neutra-ambivalente (verde).
Discusión
Este trabajo tuvo por objetivos analizar, en el contexto educativo uruguayo, las propiedades de dos instrumentos que evalúan BS, identificar perfiles afectivos y explorar las EA del estudiantado. Aunque mayor evidencia es deseable, los resultados generales sugieren que SWLS y PANAS son instrumentos válidos para evaluar el BS, y que su uso en conjunción con el modelo de los perfiles afectivos y el análisis de respuestas abiertas permite representar razonablemente las tendencias y experiencias afectivas en ámbitos académicos.
Propiedades psicométricas de las escalas
SWLS mostró excelentes propiedades en todas las muestras, equivalentes a las halladas con población rioplatense (Mikulic et al. 2019) y de otras regiones (Pavot & Diener, 2008). Las correlaciones entre esta escala y PANAS, significativas pero moderadas, son consistentes con la literatura (Pavot & Diener, 2008). En el caso de PANAS, los indicadores de fiabilidad fueron aceptables, y el AFC —con el modelo ortogonal originalmente propuesto por Watson et al. (1998)— mostró excelentes medidas de ajuste para docentes y medidas aceptables para estudiantes. Coincidentemente con antecedentes en el Río de la Plata (Caicedo et al., 2018; Flores-Kanter & Medrano, 2018; Santágelo et al., 2019) y otras regiones (García, 2023), los resultados indican que la versión breve de PANAS puede ser un instrumento útil para la evaluación independiente del AN y el AP. Los indicadores sugieren un funcionamiento menos óptimo en la muestra de estudiantes más jóvenes; en muestras compuestas mayormente por estudiantes jóvenes, puede ser deseable utilizar otras versiones de PANAS (Brunet et al., 2024) o, en caso de usar esta versión, interpretar sus resultados con cautela. Por otra parte, evidencia la necesidad de considerar aspectos del desarrollo del BS a lo largo del ciclo vital.
La inconsistencia de la correlación entre AP y AN (no significativa en docentes y EMS, significativa y positiva en estudiantes de EMB) son coherentes con los estudios previos que señalan que AP y AN podrían no ser completamente independientes (ej., Caicedo et al., 2018). Desde una perspectiva más general, estos resultados son consistentes con la propuesta de que, en tanto AP y AN forman parte de un meta-sistema adaptativo dinámico, es deseable combinar aproximaciones orientadas a las variables con abordajes orientados a las personas, como el del modelo de los perfiles afectivos (García, 2023; Schütz et al., 2013).
Perfiles afectivos
Las propiedades intrínsecas de la escala PANAS —la dispersión de las puntuaciones totales y la ausencia de correlación entre subescalas— tienen como corolario la potencialidad de identificar cuatro perfiles. Los resultados de las exploraciones gráficas, el análisis cuantitativo y el análisis de lenguaje sugieren que ese modelo, propuesto por Norlander et al. (2002), es un modo razonable de representar las tendencias y experiencias afectivas de estudiantes y docentes de educación secundaria, poniendo el foco en la persona.
Para identificar los perfiles, el análisis de conglomerados resultó más adecuado que el método de median-splits, tanto por motivos de consistencia teórica, ya que pone el foco en el parecido entre sujetos y no en medidas de tendencia central de la variable, como por motivos empíricos, ya que mostró mayor homogeneidad intra-grupo. Sin embargo, los altos porcentajes de acuerdo (equivalentes a los reportados por García et al., 2015) sugieren que el método de median-splits no debe descartarse por ser menos fiable (García & MacDonald, 2023). A su vez, esta convergencia también hace más fiable la asimilación de los conglomerados obtenidos con k-means al modelo de los cuatro perfiles afectivos.
Predeciblemente, se observan diferencias significativas en SV entre los perfiles SF y SD; sin embargo, en ninguna de las muestras se encontraron diferencias entre los perfiles LA y HA. Estos perfiles mostraron puntuaciones significativamente mayores de SV que el perfil SD, pero inferiores que el perfil SF. Aunque consistentes con la tendencia de los perfiles SF, HA y LA a tener alta SV (García, 2023), estos resultados difieren con los de García y MacDonald (2023) en EE. UU., quienes encontraron diferencias entre HA y LA, pero no entre SF y HA. Considerando el carácter cognitivo y reflexivo de la SV, parece razonable hipotetizar que estas diferencias puedan deberse a diferencias culturales acerca de qué experiencias afectivas son típicamente consideradas compatibles con una vida satisfactoria. Así como EE. UU. acepta y valida rasgos asociados al perfil HA (García & MacDonald, 2023), es plausible que una cultura como la uruguaya —que es estereotipada como “mesurada y tranquila” (Pais, 2019), “familiera”, “quejosa”, “nostálgica”, “perezosa” y “tradicionalista” (Pérez, 2007)— esté más dispuesta que la norteamericana a relativizar el valor de la experiencia positiva y juzgar como satisfactoria una vida de baja afectividad.
La menor proporción observada de participantes mujeres en los perfiles SF y LA es consistente con antecedentes (Adrianson, 2023; García et al., 2015; Sagone et al., 2023). Sin embargo, como señalan García y MacDonald (2023), lo más plausible es que la afectividad no se relacione con el género per se, sino más bien con la forma en que las diferencias individuales, por ejemplo, la personalidad, son codificadas según el género de la persona. Teniendo presente la relevancia de los estereotipos de género en la construcción de la identidad particularmente en el plano de la afectividad (Manchini & Martínez, 2025), se considera necesario realizar estudios que atiendan con detalle esta variable, investigando no solo las diversas maneras de desplegar una identidad masculina o femenina, sino también las identidades de personas no-binarias, trans, queer, inter alia.
Emociones académicas
Antecedentes como los de García et al. (2016) y García y Sikström (2023) sugieren la posibilidad de incluir medidas de lenguaje en la discusión sobre perfiles afectivos, particularmente utilizando textos generados específicamente en relación con el fenómeno psicológico de interés. Los resultados de este trabajo muestran que este enfoque es fructífero: no solo se encontró un uso distintivo del vocabulario (García et al., 2016), consistente con la teoría (García, 2023), sino que ese vocabulario ilustra de manera cualitativa qué experiencia tiene el estudiantado de cada perfil.
En términos cuantitativos, los resultados son consistentes con los antecedentes (ej., Wong et al., 2024; Zalazar-Jaime et al., 2022) en sugerir que el BS se relaciona con las EA, o más precisamente en este caso, con la polarización positiva/negativa del reporte del estudiantado (la proporción de EA con valencia negativa). Aunque predecible, este no deja de ser un hallazgo relevante para la práctica: al pensar el bienestar en el contexto educativo de manera situada, junto a los factores sociopolíticos y específicos de la institución, deben considerarse los factores relacionados con la persona (Dávila et al., 2024).
Considerando que el vocabulario emocional comunica información diversa acerca de la experiencia (Cochrane, 2009; Soriano, 2016), el reporte se puede utilizar como ventana a diferentes formas de experimentar la institución educativa. Por ejemplo, el estudiantado del perfil SD se distinguen por reportar con mayor frecuencia emociones desagradables; pero, más allá de la valencia, palabras como soledad, desinterés, desmotivación, decepción, presión y desesperación indican una experiencia de repulsión (vs. atracción), de debilidad e incertidumbre (vs. potencia y predictibilidad) y de desconexión (vs. conexión) social (Cochrane, 2009). En contraste, los estudiantes del perfil SF se distinguen por reportar emociones de valencia positiva que indican atracción (como curiosidad, motivación, interés y entusiasmo), potencia (orgullo, responsabilidad, creatividad), predictibilidad (tranquilidad, satisfacción, contento) y conexión social (empatía, amistad, acompañada, amor). Como es teóricamente esperable (García, 2023), los resultados de los perfiles LA y HA son variados; sin embargo, resalta que, en ambas muestras, el vocabulario distintivo del perfil HA parece apuntar a una experiencia de debilidad e incertidumbre (confusión, inseguridad, impotencia, susto, miedo).
En general, estos resultados sugieren que la combinación de escalas breves con preguntas abiertas es una forma válida y eficiente de obtener información situada sobre el bienestar en espacios educativos. Su integración en sistemas que evalúen de manera recurrente variables psicoeducacionales (ej., Zenteno-Osorio & Leal-Soto, 2023), permitiría a las instituciones disponer de retroalimentación relevante acerca de su funcionamiento. Monitorear de manera responsable y comprender las dinámicas del bienestar favorece el desarrollo de acciones informadas y focalizadas, a nivel personal, institucional y sociopolítico (Dávila et al., 2024). Por ejemplo, las intervenciones orientadas a abordar las estrategias de regulación emocional a nivel personal (Body et al., 2016; Salcido-Cibrián et al., 2019; Schmitz, 2024; Stockinger et al., 2025) pueden realizarse de manera más dirigida si se considera la variedad de perfiles afectivos: es esperable que las personas se beneficien de distintos tipos de prácticas y recursos según su perfil.
A nivel institucional, la utilización del propio vocabulario emocional del estudiantado permite obtener información acerca del componente cognitivo de la experiencia académica, yendo más allá del afecto positivo y negativo (Soriano, 2016). Por ejemplo, las referencias a experiencias de ansiedad, estrés y cansancio no solo comunican una experiencia negativa, sino que también sugieren que la institución educativa es percibida como un entorno poco atrayente, que genera sensaciones de impotencia, falta de control y desconexión con otras personas. Esto puede usarse como guía para implementar intervenciones educativas —tanto dentro como fuera del aula (Manchini, Mels et al., 2024)—, así como para propiciar el desarrollo de intervenciones áulicas e institucionales que atiendan específicamente a las emociones académicas identificadas. Por último, a nivel sociopolítico resulta de particular importancia contar con recursos que permitan representar las emociones del estudiantado desde sus propias palabras para evitar que se realice una representación sesgada en función de intereses ajenos a los de los sujetos de la educación (Palacios-Díaz et al., 2023). Por ejemplo, en Uruguay ese sesgo se ha documentado en proyectos de educación emocional impulsados desde sectores conservadores (Palacios-Díaz et al., en prensa).
El bienestar y la experiencia emocional se encuentran en el núcleo del proyecto de educar; las herramientas y los modelos propuestos, aunque limitados y perfectibles, permiten prestarles atención de manera rigurosa.
Limitaciones y prospectiva
Además de las limitaciones inherentes a los métodos utilizados, este estudio tiene una serie de limitaciones específicas. En primer lugar, el diseño transversal no permite estudiar el desarrollo del bienestar a lo largo de la adolescencia ni establecer relaciones de causalidad relevantes (por ejemplo, entre el BS y las EA). Igualmente, el carácter intencional de la muestra hace cuestionable la generalización de estos resultados. En ese sentido, sería recomendable avanzar hacia estudios longitudinales con muestras representativas. En segundo lugar, para confirmar con mayor profundidad la validez de las escalas sería deseable poder contar con medidas adicionales (por ejemplo, de bienestar eudaimónico o de salud mental, que permitieran evaluar la validez convergente y divergente); también sería deseable analizar la fiabilidad test-retest. En tercer lugar, aunque este estudio incluye docentes y estudiantes, el diseño no permite abordar preguntas interesantes acerca de las interacciones entre estos grupos (por ejemplo, si el BS del profesorado influye en el BS o las EA del estudiantado). Por último, también es de notar que muchas de estas variables podrían tener relaciones interesantes con los datos que las propias instituciones producen y registran sobre sus estudiantes (calificaciones, asiduidad, participación en actividades, sociogramas, datos sociodemográficos, etc.). Es necesario vincular esas medidas si se pretende avanzar en modelos que den cuenta del bienestar en contextos educativos y diseñar intervenciones para promoverlo activamente, especialmente en un tramo del sistema educativo con grandes dificultades para retener a sus estudiantes.
Conclusiones
En un contexto donde el bienestar ocupa un lugar cada vez más central, este trabajo aporta evidencia y recursos de evaluación que permiten avanzar en investigación y orientar acciones sistemáticas para promoverlo entre estudiantes y docentes. Además de validar escalas frecuentemente utilizadas, integró un modelo de perfiles afectivos con foco en la persona y técnicas de análisis cuantitativo de lenguaje, permitiendo una visión contextualizada de la experiencia afectiva en el entorno educativo. Tanto los cuestionarios como el lenguaje abren una ventana a la experiencia en contextos educativos, lo que habilita una comprensión más cabal de sus dinámicas. Disponer de evidencia y herramientas para atender el bienestar permite abordar desde nuevas perspectivas algunos de los desafíos perennes de la educación, como la permanencia, la motivación y las relaciones docente-estudiante. Permite a las instituciones educativas, también, acercarse de manera sistemática al más general de los objetivos: el buen vivir.
Referencias
Adrianson, L. (2023). Affective profiles, health, and well-being in Indonesia. En D. García (Ed.), The affective profiles model (pp. 175-190). Springer. https://doi.org/10.1007/978-3-031-24220-5_2
Ahmed, S. (2021). La promesa de la felicidad. Caja negra.
Anselmi, A., Cracco, C., Estradé, A., Solmi, M., & Correll, C. U. (2024). Impactos de la pandemia de COVID-19 sobre el bienestar y la salud mental de adultos uruguayos. Ciencias Psicológicas, 18(2), e-4059. https://doi.org/10.22235/cp.v18i2.4059
Body, L., Ramos, N., Recondo, O., & Pelegrina, M. (2016). Desarrollo de la inteligencia emocional a través del programa mindfulness para regular emociones (PINEP) en el profesorado. Revista Interuniversitaria de Formación del Profesorado, 30(87), 47-59.
Boyd, R., & Schwartz, H. (2021). Natural language analysis and the psychology of verbal behavior: The past, present, and future states of the field. Journal of Language and Social Psychology, 40(1), 1-21. https://doi.org/10.1177/0261927X20967028
Bravo-Sanzana, M., Casas, F., Rodríguez-Rivas, M. E., Oriol, X., Varela, J. J., Miranda, R., & Terán-Mendoza, O. (2025). Instruments for measuring hedonic and eudaimonic well-being of adolescents in the Latin American school contexts: A systematic review. Child Indicators Research, 18(3), 955-1000. https://doi.org/10.1007/s12187-025-10231-z
Brown, J. L. D., & Potter, S. (2024). Integrating the philosophy and psychology of well-being: An opinionated overview. Journal of Happiness Studies, 25(5). https://doi.org/10.1007/s10902-024-00763-6
Brunet, N., Tórtora, G., Suñol, N., & Fernández-Berrocal, P. (2024). Evaluación de la aplicación del Positive and Negative Affect Schedule (PANAS-N) para adolescentes uruguayos en contextos de vulnerabilidad social. En V. Ortuño (moderador), Simposio de desarrollo y adaptación de instrumentos de evaluación psicológica en el Uruguay. VI Simposio de Investigación en Psicología, Universidad Católica del Uruguay, Montevideo, Uruguay.
Caicedo, E., Michelini, Y., Belaus, A., Mola, D. J., Godoy, J. C., & Reyna, C. (2018). Further considerations regarding PANAS: Contributions from four studies with different Argentinean samples. Suma Psicológica, 25(2), 133-145. https://doi.org/10.14349/sumapsi.2018.v25.n2.5
Camacho, J., Slemp, G.R., Pekrun, R., Loderer, K., Hou, H., & Oades, L. (2021). Activity achievement emotions and academic performance: A meta-analysis. Educational Psychology Review, 33(4), 1051-1095. https://doi.org/10.1007/s10648-020-09585-3
Camps, V. (2019). La búsqueda de la felicidad. Arpa.
Carrizo L. (2021). Salud mental en Uruguay en época de COVID 19. Informe de Estado de Situación, (4). Academia Nacional de Ciencias del Uruguay. https://anciu.org.uy/risep/serie-estados-de-situacion-risep.html
Chiarino, N., Curione, K., & Huertas Martinez, J. A. (2024). Clima motivacional de clase en la enseñanza media y superior iberoamericana: una revisión sistemática. Ciencias Psicológicas, 18(2), e-3770. https://doi.org/10.22235/cp.v18i2.3770
Cochrane, T. (2009). Eight dimensions for the emotions. Social Science Information, 48(3), 379-420. https://doi.org/10.1177/0539018409106198
Crisp, R. (2017). Well-Being. En E. N. Zalta (Ed.), The Stanford Encyclopedia of Philosophy. https://plato.stanford.edu/archives/fall2017/entries/well-being
Cunsolo, S. (2017). Subjective wellbeing during adolescence: a literature review on key factors relating to adolescents’ subjective wellbeing and education outcomes. Studi Sulla Formazione, 20(1), 81-94. https://doi.org/10.13128/Studi_Formaz-20941
Curren, R., Boniwell, I., Ryan, R. M., Oades, L., Brighouse, H., Unterhalter, E., Kristjánsson, K., De Ruyter, D., Macleod, C., Morris, I., & White, M. (2024). Finding consensus on well-being in education. Theory and Research in Education, 22(2), 117-157. https://doi.org/10.1177/14778785241259852
Dávila, J. R., Huertas, J. A., & Leal-Soto, F. (2024). Estructura psicológica del bienestar docente: justificación de un modelo situado. Revista de Psicodidáctica, 29(1), 19-27. https://doi.org/10.1016/j.psicod.2023.11.001
Diener, E. (1994). Bienestar subjetivo. Intervención Psicosocial, 3(8), 67-113.
Diener, E., Emmons, R. A., Larsen, R. J., & Griffin, S. (1985). The Satisfaction with Life Scale. Journal of Personality Assessment, 49(1), 71-75. https://doi.org/10.1207/s15327752jpa4901_13
Diener, E., Heintzelman, S. J., Kushlev, K., Tay, L., Wirtz, D., Lutes, L. D., & Oishi, S. (2017). Findings all psychologists should know from the new science on subjective well-being. Canadian Psychology, 58(2), 87-104. https://doi.org/10.1037/cap0000063
Feinerer, I., Hornik, K., & Meyer, D. (2008). Text mining infrastructure in R. Journal of Statistical Software, 25(5), 1-54. https://doi.org/10.18637/jss.v025.i05
Feldman-Barrett, L., & Bliss-Moreau, E. (2009). Affect as a psychological primitive. Advances in Experimental Social Psychology, 41, 167-218. https://doi.org/10.1016/S0065-2601(08)00404-8
Fernandes, R., & Araujo, N. (2018). Bienestar subjetivo de niños/as y adolescentes: revisión integradora. Ciencias Psicológicas, 12(2), 249-260. https://doi.org/10.22235/cp.v12i2.1689
Fernández, M. E., Castelluccio, L., Sanjurjo, I., & Daset, L. (2024). Adolescent and parental risk perception of alcohol and marijuana use and well-being of adolescents in Uruguay. En M. Florence, W. Vanderplasschen, M. Yu, J. De Maeyer & S. Savahl (Eds.), Handbook of Addiction, Recovery and Quality of Life. International Handbooks of Quality-of-Life (pp. 435-446). Springer. https://doi.org/10.1007/978-3-031-65873-0_30
Flores-Kanter, P. E., & Medrano, L. A. (2016). El afecto y sus dimensiones: Contrastes de modelos ortogonales y oblicuos mediante análisis factorial confirmatorio de la escala PANAS. LIBERABIT, 22(2), 173-184. https://doi.org/10.24265/liberabit.2016.v22n2.05
Flores-Kanter, P. E., & Medrano, L. A. (2018). Comparación de dos versiones reducidas de la Escala PANAS: Análisis factoriales en una muestra argentina. Revista Iberoamericana de Diagnóstico y Evaluación, 49(4), 37-46. https://doi.org/10.21865/ridep49.4.03
Fondo de las Naciones Unidas para la Infancia. (2022). Situación de bienestar psicosocial y salud mental en adolescentes y jóvenes en Uruguay. https://bibliotecaunicef.uy/documentos/267_Situacion%20de%20bienestar%20psicosocial%20salud%20mental%20adolescentes%20Uruguay.pdf
Gallup. (2024). Gallup Global Emotions Report 2024.
García, D. (2023). The story of the affective profiles model: Theory, Concepts, Measurement, and Methodology. En: D. García (Ed.), The affective profiles Model (pp. 3–23). Springer. https://doi.org/10.1007/978-3-031-24220-5_1
García, D., & MacDonald, S. (2023). The (mis)measurement of the affective profiles model: Should I split or should I cluster? En D. García (Ed.), The affective profiles model (pp. 25-48). Springer. https://doi.org/10.1007/978-3-031-24220-5_2
García, D., & Sikström, S. (2023). Innovative methods for affectivity profiling: Quantitative semantics. En D. García (Ed.), The affective profiles model (pp. 89-104). Springer. https://doi.org/10.1007/978-3-031-24220-5_4
García, D., Kjell, O. N. E., & Sikström, S. (2019). A collective picture of what makes people happy: Words representing social relationships, not money, are recurrent with the word ‘happiness’ in online newspapers. En P. Benson, B. Dalmaso, & I. Stefan (Eds.), The psychology of social networking Vol. 2: Identity and relationships in online communities (pp. 4-16). De Gruyter Open Poland. https://doi.org/10.1515/9783110473858-003
García, D., Kjell, O. N. E., Sikström, S., & Archer, T. (2016). Using language and affective profiles to investigate differences between individuals. Clinical and Experimental Psychology, 2(2), 123. https://doi.org/10.4172/2471-2701.1000123
Garcia, D., MacDonald, S., & Archer, T. (2015). Two different approaches to the affective profles model: Median splits (variable-oriented) and cluster analysis (person-oriented). PeerJ, 3, e1380. https://doi.org/10.7717/peerj.1380
García-Álvarez, D., Hernández, J., Espinosa, J., & Soler, M. (2020). Validación de la escala de bienestar psicológico para jóvenes de Casullo en adolescentes montevideanos. Revista Latinoamericana de Hipertensión, 15(5), 1-12. https://doi.org/10.5281/zenodo.4487296
Hu, L., & Bentler, P. M. (1999). Cutoff criteria for fit indexes in covariance structure analysis: Conventional criteria versus new alternatives. Structural Equation Modeling, 6, 1-55. https://doi.org/10.1080/10705519909540118
Huertas, J. A. (2012). Los efectos de los afectos en la motivación y la autorregulación. Ciencias Psicológicas, 6(1), 45-55. https://doi.org/10.22235/cp.v6i1.62
Instituto Nacional de Evaluación Educativa. (2020). Estudio de salud ocupacional docente.
Instituto Nacional de Evaluación Educativa. (2023a). Informe sobre el estado de la educación en Uruguay 2021-2022.
Instituto Nacional de Evaluación Educativa. (2023b). Aristas 2022: Informe de Resultados de Educación Media.
Lei, H., Cui, Y., & Chiu, M. M. (2018). The Relationship between Teacher Support and Students' Academic Emotions: A Meta-Analysis. Frontiers in Psychology, 8, 2288. https://doi.org/10.3389/fpsyg.2017.02288
Li, C. (2016). Confirmatory factor analysis with ordinal data: Comparing robust maximum likelihood and diagonally weighted least squares. Behavioral Research Methods 48, 936-949. https://doi.org/10.3758/s13428-015-0619-7
Manchini, N., & Martínez, M. (2025). “Basta que me enamores –o que me mandes flores”: género, experiencia y emociones en el corpus del pop-rock en español. Archiv für Textmusikforschung, 9(1), 1-21. https://doi.org/10.15203/ATeM_2025_1.7
Manchini, N., Jiménez, O., Ramos-Díaz, N., & Trías, D. (2024). Affect and words: An instrument for the quantitative analysis of emotional vocabulary in open-ended responses. https://doi.org/10.31234/osf.io/tmnxw
Manchini, N., Mels, C., & Lacruz, N. (2024). Educar en habilidades emocionales en Uruguay. En C. Mels, M. Báez & N. Lacruz (Coords.), ¿Cómo educar en habilidades socioemocionales? (pp. 135-143). Universidad Católica del Uruguay.
Medrano, L., Flores, P, Trógolo, M. Curarello, A., & González, J. (2015). Adaptación de la Escala de Afecto Positivo y Negativo (PANAS) para la población de estudiantes universitarios de Córdoba. Anuario de investigaciones de la Facultad de Psicología, 2(1), 22-36.
Melo, G., Dias, C. L., Ramos, I. A., Brandão, M., & Winckler, C. (2023). Psychometric properties of the Satisfaction with Life Scale in Brazilian Para athletes. Cuadernos de Psicología del Deporte, 23(2), 133-145. https://doi.org/10.6018/cpd.530191
Mels, C., De Lema, S., & Irigoyen, M. (2024). Bienestar docente en Uruguay: una exploración desde la perspectiva de docentes de educación primaria y media. Agencia Nacional de Investigación e Innovación, Universidad Católica del Uruguay, Administración Nacional de Educación Pública.
Mikulic, I. M., Crespi, M., & Caballero, R. Y. (2019). Escala de Satisfacción con la Vida (SWLS): Estudio de las propiedades psicométricas en adultos de Buenos Aires. Anuario de Investigaciones Facultad de Psicología de la UBA, 27, 395-402.
Norlander, T., Bood, S.-Å., & Archer, T. (2002). Performance during stress: Affective personality, age, and regularity of physical exercise. Social Behavior and Personality: An International Journal, 30(5), 495-508. https://doi.org/10.2224/sbp.2002.30.5.495
Ogden, J., & Lo, J. (2011). How meaningful are data from Likert scales? An evaluation of how ratings are made and the role of the response shift in the socially disadvantaged. Journal of Health Psychology, 17(3), 350-361. https://doi.org/10.1177/1359105311417192
Ogle, D., Doll, J., Wheeler, A., & Dinno, A. (2023). FSA: Simple Fisheries Stock Assessment Methods. R package version 0.9.5 (Software). https://CRAN.R-project.org/package=FSA
Organización Mundial de la Salud & Fondo de las Naciones Unidas para la Infancia. (2021). Investing in our future: A comprehensive agenda for the health and well-being of children and adolescents. https://iris.who.int/bitstream/handle/10665/350239/9789240037793-eng.pdf?sequence=1&isAllowed=y
Pais, A. (2019, 13 de febrero). ¿Es cierto que los uruguayos son "todos buenos" (y qué tienen que ver los argentinos con ese estereotipo)? BBC News Mundo. https://www.bbc.com/mundo/noticias-47148158
Palacios-Díaz, D., Dufraix, I., Sisto, V., & Ramírez, L. (2023). Conteniendo afectos: análisis discursivo de orientaciones educativas en Chile. Cadernos de Pesquisa, 53(1). https://doi.org/10.1590/1980531410053
Palacios-Díaz, D., Manchini, N., & Báez, T. (en prensa). Legislar las emociones: Análisis discursivo de proyectos de ley sobre educación emocional en Chile y Uruguay. Archivos Analíticos de Políticas Educativas.
Papamitsiou, Z., & Economides, A. A. (2014). Learning analytics and educational data mining in practice: A systematic literature review of empirical evidence. Educational Technology y Society, 17(4), 49-64.
Pavot, W., & Diener, E. (2008). The Satisfaction with Life Scale and the emerging construct of life satisfaction. The Journal of Positive Psychology, 3(2), 137-152. https://doi.org/10.1080/17439760701756946
Pekrun, R. (2016). Using self-report to assess emotions in education. Methodological Advances in Research on Emotion and Education, 43-54. https://doi.org/10.1007/978-3-319-29049-2_4
Pekrun, R., Marsh, H. W., Elliot, A. J., Stockinger, K., Perry, R. P., Vogl, E., Goetz, T., Van Tilburg, W. A. P., Lüdtke, O., & Vispoel, W. P. (2023). A three-dimensional taxonomy of achievement emotions. Journal of Personality and Social Psychology, 124(1), 145-178. https://doi.org/10.1037/pspp0000448
Pérez, P. (2007). Identidades, actitudes y estereotipos nacionales y supranacionales en una muestra uruguaya. Ciencias Psicológicas, 1(1), 81-102. https://doi.org/10.22235/cp.v0i1.574
Portela, M. (2021). Estudio preliminar de las propiedades psicométricas de la escala de funcionamiento psicológico positivo para una muestra de adolescentes uruguayos. Ciencias Psicológicas, 15(1), e-2396. https://do i.org/10.22235/cp.v15i1.2396
R Core Team. (2021). R: A language and environment for statistical computing (Software). R Foundation for Statistical Computing. https://www.R-project.org/.
Real Academia Española. (s.f.). Corpus del Español del siglo XXI (CORPES). Recuperado el 23 de junio de 2024, de https://www.rae.es/corpes/
Revelle, W. (2022). psych: Procedures for psychological, psychometric, and personality research (R package version 2.2.9) (Software). https://CRAN.R-project.org/package=psych
Rivera-Vargas, P., & Oyanedel, J. C. (2023). Subjective well-being in online and mixed educational settings. Frontiers in Psychology, 14, 1152373. https://doi.org/10.3389/fpsyg.2023.1152373
Rosseel, Y. (2012). lavaan: An R Package for Structural Equation Modeling. Journal of Statistical Software, 48(2), 1-36. https://doi.org/10.18637/jss.v048.i02
Rowan, A. N. (2022). World happiness report 2022. WellBeing News, 4(3), 2.
Ruiz, F. J., Suárez-Falcón, J. C., Flórez, C. L., Odriozola-González, P., Tovar, D., López-González, S., & Baeza-Martín, R. (2019). Validity of the Satisfaction with Life Scale in Colombia and factorial equivalence with Spanish data. Revista Latinoamericana de Psicología, 51(2), 58-65. https://doi.org/10.14349/rlp.2019.v51.n2.1
Ryan, R. M., & Deci, E. L. (2001). On happiness and human potentials: A review of research on hedonic and eudaimonic well-being. Annual Review of Psychology, 52, 141-166. https://doi.org/10.1146/annurev.psych.52.1.141
Sagone, E., & De Caroli, M. (2023). Affectivity and well-being in Italian samples of adolescents and young adults. En D. García (Ed.), The affective profiles model (pp. 191–205). Springer. https://doi.org/10.1007/978-3-031-24220-5_11
Sagone, E., De Caroli, M., & Indiana, M. (2023). Differences in procrastination, well-being, and average grades in exams among Italian university students with different affective profiles. En D. García (Ed.), The affective profiles model (pp. 207-224). Springer. https://doi.org/10.1007/978-3-031-24220-5_12
Salcido-Cibrián, L. J., Ramos, N. S., Jiménez, Ó., & Blanca, M. J. (2019). Mindfulness to regulate emotions: The Mindfulness and Emotional Intelligence Program (PINEP) and its adaptation to a virtual learning platform. Complementary Therapies in Clinical Practice, 36, 176-180. https://doi.org/10.1016/j.ctcp.2019.07.003
Santángelo, P. R., Brandariz, R., Cremonte, M., & Conde, K. (2019). Nuevas evidencias de las propiedades psicométricas del PANAS en población estudiantil argentina. Revista Argentina de Clínica Psicológica, 28(5), 752-760. https://doi.org/10.24205/03276716.2019.1118
Schmitz, B. (2024). What teachers can do to enhance students’ well-being: Discussion. Learning and Instruction, 94, 101980. https://doi.org/10.1016/j.learninstruc.2024.101980
Schütz, E., Sailer, U., Al Nima, A., Rosenberg, P., Andersson Arntén, A.-C., Archer, T., & García, D. (2013). The affective profiles in the USA: Happiness, depression, life satisfaction, and happiness-increasing strategies. PeerJ, 1, e156. https://doi.org/10.7717/peerj.156
Silge, J., & Robinson, D. (2016). tidytext: Text mining and analysis using tidy data principles in R. Journal of Open Source Software, 1(3). https://doi.org/10.21105/joss.00037.
Soriano, C. (2016). El lenguaje de las emociones. En M. C. Horno Chéliz, I. Ibarretxe Antuñano & J. L. Mendívil Giró (Eds.), Panorama actual de la ciencia del lenguaje (pp. 243-259). Prensas de la Universidad de Zaragoza.
Stockinger, K., Dresel, M., Marsh, H., & Pekrun, R. (2025). Strategies for Regulating Achievement Emotions: Conceptualization and Relations with University Students’ Emotions, Well-Being, and Health. PsyArXiv. https://doi.org/10.31234/osf.io/egm2p_v2
Tan, J., Mao, J., Jiang, Y., & Gao, M. (2021). The influence of academic emotions on learning effects: A systematic review. International Journal of Environmental Research and Public Health, 18(18), 9678. https://doi.org/10.3390/ijerph18189678
Tarka, P. (2017). The comparison of estimation methods on the parameter estimates and fit indices in SEM model under 7-point Likert scale. Archives of Data Science, 2(1). https://doi.org/10.5445/KSP/1000058749/10
Tomczak, M., & Tomczak, E. (2014). The need to report effect size estimates revisited: An overview of some recommended measures of effect size. Trends in Sport Sciences, 21(1), 19-25.
Vine, V., Boyd, R. L., & Pennebaker, J. W. (2020). Natural emotion vocabularies as windows on distress and well-being. Nature Communications, 11(1), 4525. https://doi.org/10.1038/s41467-020-18349-0
Watson, D., Clark, L. A., & Tellegen, A. (1988). Development and validation of brief measures of positive and negative affect: the PANAS scales. Journal of Personality and Social Psychology, 54(6), 1063-1070. https://doi.org/10.1037//0022-3514.54.6.1063
Wickham, H., Averick, M., Bryan, J., Chang, W., McGowan, L., François, R., Grolemund, G., Hayes, A., Henry, L., Hester, J., Kuhn, M., Pedersen, T., Miller, E., Bache, S., Müller, K., Ooms, J., Robinson, D., Seidel, D., Spinu, V., … Yutani, H. (2019). Welcome to the tidyverse. Journal of Open Source Software, 4(43), 1686.
Wong, Z. Y., Liem, G. A. D., Chan, M., & Datu, J. A. D. (2024). Student engagement and its association with academic achievement and subjective well-being: A systematic review and meta-analysis. Journal of Educational Psychology, 116(1), 48-75. https://doi.org/10.1037/edu0000833
Zalazar-Jaime, M. F., Moretti, L. S., & Medrano, L. A. (2022). Contribution of academic satisfaction judgments to subjective well-being. Frontiers in Psychology, 13, 772346. https://doi.org/10.3389/fpsyg.2022.772346
Zenteno-Osorio, S., & Leal-Soto, F. (2023). Transfer of an information system and monitoring of psychological well-being in educational contexts: A collaborative experience between a research center and schools in the Tarapacá region – Chile. Praxis Educativa, 27(1), 1-22. https://doi.org/10.19137/praxiseducativa-2023-270120
Zhou, J., & Ye, J. (2020). Sentiment analysis in education research: a review of journal publications. Interactive Learning Environments, 31(3), 1252-1264. https://doi.org/10.1080/10494820.2020.1826985
Disponibilidad de datos: Los datos, códigos analíticos y materiales suplementarios se encuentran disponibles en Open Science Framework (https://www.doi.org/10.17605/OSF.IO/N4PJ2).
Financiamiento: Este estudio recibió apoyo económico de la Agencia Nacional de Investigación e Innovación de Uruguay, a través del proyecto POS_EXT_2021_1_172077.
Conflicto de interés: Los autores declaran no tener ningún conflicto de interés.
Cómo citar: Manchini, N., Trías Seferian, D., Jiménez, O., & Ramos-Díaz, N. (2025). Bienestar subjetivo de estudiantes y docentes de Uruguay: satisfacción con la vida, perfiles afectivos y emociones académicas. Ciencias Psicológicas, 19(2), e-4401. https://doi.org/10.22235/cp.v19i2.4401
Contribución de los autores (Taxonomía CRediT): 1. Conceptualización; 2. Curación de datos; 3. Análisis formal; 4. Adquisición de fondos; 5. Investigación; 6. Metodología; 7. Administración de proyecto; 8. Recursos; 9. Software; 10. Supervisión; 11. Validación; 12. Visualización; 13. Redacción: borrador original; 14. Redacción: revisión y edición.
N. M. ha contribuido en 1, 2, 3, 4, 5, 6, 7, 8, 9, 11, 12, 13, 14; D. T. S. en 1, 3, 4, 5, 6, 7, 8, 10, 11, 12, 13, 14; O. J. en 4, 5, 7, 8, 10, 11, 12, 14; N. R. D. en 4, 5, 7, 8, 10, 11, 12, 14.
Editora científica responsable: Dra. Cecilia Cracco.
Ciencias Psicológicas; v19(2)
July-December 2025
10.22235/cp.v19i2.4401
Original Articles
Subjective Well-Being of Students and Teachers in Uruguay: Life Satisfaction, Affective Profiles and Academic Emotions
Bienestar subjetivo de estudiantes y docentes de Uruguay: satisfacción con la vida, perfiles afectivos y emociones académicas
Bem-estar subjetivo de estudantes e docentes no Uruguai: satisfação com a vida, perfis afetivos e emoções acadêmicas
Nigel Manchini1, ORCID 0000-0002-1221-9259
Daniel Trías Seferian2, ORCID 0000-0003-1274-9134
Óliver Jiménez3, ORCID 0000-0003-0314-8396
Natalia Ramos-Díaz4, ORCID 0000-0003-4269-8948
1 Universidad de Málaga, Spain, [email protected]
2 Universidad Católica del Uruguay, Uruguay
3 Universidad de Málaga, Spain
4 Universidad de Málaga, Spain
Abstract:
Although affect and well-being occupy a central place in educational discourse, resources and evidence are still scarce. This study sought to analyze the psychometric properties of brief instruments, identify affective profiles and explore the emotions that students associate with their institution. The participants were teachers (n = 350), middle school students (n = 357) and high school students (n = 375) from Uruguay, who completed subjective well-being scales (SWLS and PANAS) and an open-ended question processed through automated text analysis. Factor, reliability and correlation analyses suggest the validity of both scales; cluster analysis suggests the existence of four affective profiles similar to Norlander et al.'s (2002) model: self-fulfilling, self-destructive, high-affective and low-affective. Although the educational institution is predominantly associated with unpleasant experiences (such as stress, tiredness, sadness and anxiety), it is also associated with joy and happiness. Differences were identified depending on the affective profile: for example, associations with interest, motivation and curiosity are distinctive of the self-fulfilling profile, while disappointment, displeasure and loneliness are distinctive of the self-destructive profile. The results suggest that the conjunction of scales and text analysis allows for insights into well-being in educational contexts.
Keywords: well-being; affectivity; secondary education; psychological assessment; adolescents.
Resumen:
Aunque el afecto y el bienestar ocupan un lugar central en el discurso educativo, los recursos y la evidencia son todavía escasos. Este trabajo buscó analizar propiedades psicométricas de instrumentos breves, identificar perfiles afectivos y explorar las emociones que el estudiantado asocia a su institución. Participaron docentes (n = 350), estudiantes de educación media básica (n = 357) y media superior (n = 375) de Uruguay, quienes cumplimentaron escalas de bienestar subjetivo (SWLS y PANAS) y una pregunta abierta procesada mediante análisis automatizado de textos. Los análisis factoriales, de fiabilidad y de correlación sugieren la validez de ambas escalas, mientras que los análisis de conglomerados sugieren la existencia de cuatro perfiles afectivos asimilables al modelo de Norlander et al. (2002): autorrealizado, autodestructivo, alta-afectividad y baja-afectividad. Aunque la institución educativa es asociada predominantemente a experiencias desagradables (como estrés, cansancio, tristeza y ansiedad) también se la asocia con alegría y felicidad. Se identificaron diferencias dependiendo del perfil afectivo: por ejemplo, las asociaciones con interés, motivación y curiosidad son distintivas del perfil autorrealizado, mientras que decepción, desagrado y soledad lo son del autodestructivo. Los resultados sugieren que la conjunción de escalas y análisis de texto permite obtener insights sobre el bienestar en contextos educativos.
Palabras clave: bienestar; afectividad; enseñanza secundaria; evaluación psicológica; adolescentes.
Resumo:
Embora o afeto e o bem-estar ocupem um lugar central no discurso educacional, os recursos e as evidências ainda são escassos. Este estudo buscou analisar propriedades psicométricas de instrumentos breves, identificar perfis afetivos e explorar as emoções que os estudantes associam à sua instituição. Participaram docentes (n = 350) e estudantes de ensino fundamental 2 (n = 357) e ensino médio (n = 375) do Uruguai, que responderam a escalas de bem-estar subjetivo (SWLS e PANAS) e a uma pergunta aberta processada por meio de análise de texto automatizada. As análises fatoriais, de confiabilidade e de correlação sugerem a validade de ambas as escalas, enquanto as análises de conglomerados indicam a existência de quatro perfis afetivos semelhantes ao modelo de Norlander et al. (2002): autorrealizado, autodestrutivo, alta afetividade e baixa afetividade. Embora a instituição educacional esteja predominantemente associada a experiências desagradáveis (como estresse, cansaço, tristeza e ansiedade), também é associada à alegria e felicidade. Foram identificadas diferenças dependendo do perfil afetivo: por exemplo, as associações com interesse, motivação e curiosidade são características do perfil autorrealizado, enquanto decepção, desagrado e solidão são típicos do perfil autodestrutivo. Os resultados sugerem que a combinação de escalas e análise de texto permite obter insights sobre o bem-estar em contextos educacionais.
Palavras-chave: bem-estar; afetividade; ensino médio; avaliação psicológica; adolescentes.
Received: 10/12/2024
Accepted: 22/05/2025
The focus on emotional well-being appears to be part of an epochal ethos with profuse manifestations in both educational and academic contexts, as well as in public policy agendas (Curren et al., 2024; Palacios-Díaz et al., 2023; Rivera-Vargas & Oyanedel, 2023; World Health Organization & United Nations Children's Fund (UNICEF), 2021). Consequently, many proposals —with different approaches and objectives— seek to address affects in the school environment. This trend, strengthened since the COVID-19 pandemic (Anselmi et al. 2024; Carrizo, 2021), is far from being a simple phenomenon: discussing affect and well-being in education involves addressing technical issues, but also philosophical and ethical-political ones (Palacios-Díaz et al., 2023).
In this context, it seems essential to have evidence and resources to attend to well-being in a systematic and non-reductionist way, analyze its dynamics, and project professional, institutional, and social actions. Addressing this need, this work analyzes the functioning of two brief instruments for evaluating student and teacher well-being, validates a person-oriented affective profiles model, and —bridging quantitative results with everyday language— conducts an analysis of students' open-ended responses regarding emotions associated with the educational institution.
Subjective well-being as an operationalization of happiness
In line with the diversity of semantic fields associated with happiness, the good life, and well-being, there has been a multiplicity of conceptual and methodological frameworks for their philosophical and empirical approach (Brown & Potter, 2024). This work operationalizes well-being from a hedonic conception (Ryan & Deci, 2001), focusing on pleasure, satisfaction, and affective experience (Crisp, 2017). Due to its simplicity and operationalizability, this approach has been able to provide a general picture of well-being at both individual and collective levels (Diener et al., 2017; Gallup, 2024; Rowan, 2022). However, the parsimony that gives it its power also imposes its limits: by reducing well-being to its affective dimension and satisfaction judgments, these approaches are unable to see —and perhaps render invisible— other relevant dimensions of the good life (Ahmed, 2021; Camps, 2019), such as autonomy, self-acceptance, positive relationships, or life purpose (Dávila et al., 2024). This work, therefore, does not address happiness but rather an operationalization: subjective well-being (SWB).
Subjective well-being and affective profiles
The model proposed by Diener (1994) identifies three components of subjective well-being (SWB): Satisfaction With Life (SWL), Positive Affect (PA), and Negative Affect (NA).
SWL, the cognitive component, refers to the general judgment a person makes about their life: a "global assessment of a person's quality of life according to their own chosen criteria" (Diener, 1994, p. 69). Although this judgment may be affected by emotional aspects, it is not an affective measure but rather the result of a cognitive process of comparison between the person's conscious perception of their life circumstances and their own explicit or implicit standards (Pavot & Diener, 2008).
The affective component, given by PA and NA, refers to pleasant and unpleasant emotional experience. Although affect is a theoretically problematic term (Feldman-Barrett & Bliss-Moreu, 2009), a generic definition like the one adopted by García (2023) captures the generality of the term's use in the SWB field: the conscious experience of feelings derived from automatic responses of the nervous system to internal and external stimuli, and —more generally— the day-to-day feelings that color experience (García, 2023). One of the core characteristics of affect is valence or hedonic tone, referring to the pleasantness/unpleasantness quality of experience that is susceptible to introspection (Feldman-Barrett & Bliss-Moreu, 2009). Taking into account evidence from psychometric studies and theoretical considerations (Diener, 1994; Diener et al., 2017), PA and NA are conceptualized and evaluated as two independent variables (in contrast with, for example, Feldman-Barrett & Bliss-Moreu, 2009). Previous research (e.g., Caicedo et al., 2018; Flores-Kanter & Medrano, 2016, 2018; Santágelo et al., 2019) consistently shows that NA and PA are not strongly and negatively related (and therefore, would not constitute two poles of a dimension), although evidence suggests they would not be completely independent either. In this regard, García (2023) has proposed that affectivity constitutes a dynamic and adaptive meta-system with NA and PA as two subsystems that are independent at a low level but interrelated at a high level.
Considering this relative independence of PA and NA, Norlander et al. (2002) proposed a model (subsequently called the affective profiles model) that identifies and names four possible combinations of high/low NA and PA (Figure 1): a Self-Fulfilling profile (SF), a Self-Destructive profile (SD), a High-Affective profile (HA) and Low Affective profile (LA).
Figure 1: Affective profiles
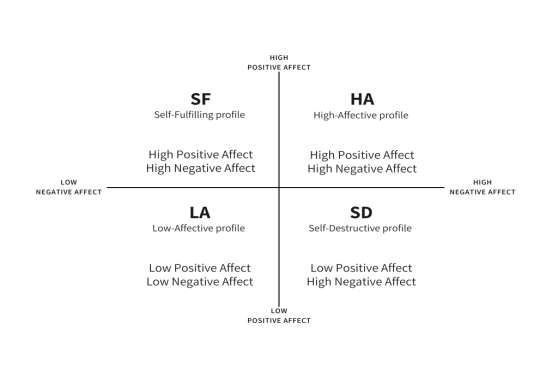
Note: Based on García (2023).
Findings regarding the characteristics of these profiles consistently suggest differences in SWL and other well-being indicators, such as autonomy, self-acceptance, etc. (García, 2023; Sagone & De Caroli, 2023) as well as in variables linked to education, such as procrastination and grades (Sagone et al., 2023). While there is clear interest in investigating these affective variables in the Río de la Plata region (Caicedo et al., 2018; Flores-Kanter & Medrano, 2018; Santágelo et al., 2019) and abundant literature on affective profiles exists, produced especially in Europe (García, 2023), studies on this model in the region are scarce (cf. Brunet et al., 2024).
The present study: well-being in educational contexts
In the context of Uruguayan education, addressing affective variables is relevant not only because of their relationship with motivation and self-regulation of learning (Chiarino et al., 2024; Huertas, 2012) and other academic variables of interest (Cunsolo, 2017; UNICEF, 2022), but also because the situation in this regard is far from ideal (Carrizo, 2021; National Institute for Educational Evaluation (INEEd), 2020, 2023a). Although well-being figures in Uruguay are comparable to those of other countries (Fernández et al., 2024; Gallup, 2024), a concerning proportion of adolescents and young people report having attempted (1.2%) or considered (3.3%) self-elimination; 14.4% say they have felt so sad or hopeless that they stopped doing their usual activities for two or more weeks (UNICEF, 2022). In this regard, the prevalence of risk behaviors in this population appears to have increased over the last decade (INEEd, 2023b; UNICEF, 2022). In the case of teachers, 26% can be considered to have low well-being when considering both positive factors (such as motivation and enthusiasm) and their stress and burnout symptoms (INEEd, 2020); which is problematic both in itself and because of its consequences on other variables (Mels et al., 2024). In the Latin American (Bravo-Sanzana et al., 2025; Dávila et al., 2024) and Uruguayan context, where there is clearly interest in evaluating the well-being of teachers (INEEd, 2020; Mels et al., 2024) and adolescents (García-Álvarez et al., 2020; INEEd, 2023b; Portela, 2021), it is striking that the scales most frequently used to evaluate hedonic well-being (Fernandes & Araujo, 2018) are not validated in educational contexts. This study aims toward that objective.
By focusing on educational contexts, it seems necessary to complement general evaluations with situated measures (Dávila et al., 2024; Fernandes & Araujo, 2018) and produce information that is relevant and interpretable for the agents involved (Zenteno-Osorio & Leal-Soto, 2023). Along these lines, this work complements the analysis of SWB scales with the exploration of an affective variable situated in the educational context —academic emotions— using an easily interpretable approach: automated analysis of words used by students in open-ended responses.
Academic emotions (AE) are defined as those experienced by students in academic settings, both those associated with learning outcomes and processes (Pekrun et al., 2023) and those related to the relationship with teachers (Lei et al., 2018). In addition to their intrinsic value associated with well-being (Stockinger et al., 2025), their relationship with learning (Tan et al., 2021), academic performance (Camacho et al., 2021), motivation and self-regulation (Pekrun et al., 2023), among other variables of interest, has also been documented.
Although other approaches have been used, the retrospective self-report scale is the most frequent type of instrument for evaluating SWB and AE (Diener et al., 2017; Pekrun, 2016). Given the subjective and conscious nature of well-being (Diener, 1994; García, 2023), it seems that the subject would be in a privileged position to report it (cf., however, Ahmed, 2021; Ogden & Lo, 2011). Even accepting this premise, the inherent limitations of the Likert-type scale make it desirable to complement this type of measure (Ogden & Lo, 2011). It has become common, in this regard, to use computational tools to quantify affective dimensions in textual data, using language as a window into experience (Boyd & Schwartz, 2021; Vine et al., 2020). This approach has been used in education (Papamitsiou & Economides, 2014; Zhou & Ye, 2020) and in the study of well-being (García et al., 2019; García & Sikström, 2023). However, its implementation in Spanish-speaking educational environments has been limited (Manchini, Jiménez et al., 2024).
In this context, this study aims to analyze SWB and AE in Uruguayan secondary education teachers and students. Specifically, it proposes to: (1) analyze the psychometric properties of two SWB scales with Uruguayan secondary education teachers and students, (2) identify affective profiles of students and teachers, and (3) explore the AE that adolescents associate with high school considering the different affective profiles.
Method
Participants
The sample consisted of 357 Lower Secondary Education students (EMB, by its acronym in Spanish; Mage = 13.6, SD = 0.76; 54.6 % female), 375 Upper Secondary Education students (EMS; Mage = 16.5, SD = 0.78; 61 % female), and 350 Teachers (Mage = 36.3, SD = 12.4; 76.2 % female) from Uruguay. Students belonged to public institutions in the region of Colonia. 95.3 % of teachers worked in public education across multiple institutions and levels. Considering the diversity of centers and levels in which the teaching staff works in the Uruguayan context, and the consequent diversity of emotional associations, academic emotions were not explored in this sample. Purposive sampling was based on accessibility to institutions and availability of participants to be part of the study.
Instruments
Satisfaction with Life Scale (SWLS). This unidimensional scale measures Satisfaction with Life (SWL) including five items that present statements with which agreement/disagreement must be expressed (e.g., I am satisfied with my life). The score for each item ranges from 1 to 7, with a minimum total score of 7 and maximum of 35. The original version was published by Diener et al. (1985) and has been used across a wide range of ages and populations (Pavot & Diener, 2008). The version adapted to Rioplatense Spanish by Mikulic et al. (2019) was used, with reliability of α = .81 in their study.
Positive and Negative Affect Schedule (PANAS, brief version). This bidimensional scale is designed to independently measure Negative Affect (NA) and Positive Affect (PA). The original English version (Watson et al., 1988) was adapted and validated for the Rioplatense variant of Spanish (Medrano et al., 2015). The brief version (Flores-Kanter & Medrano, 2018), composed of 10 items presented as adjectives describing emotions (NA: distressed (afligido), guilty (culpable), scared (asustado), nervous (nervioso), afraid (temeroso); PA: interested (interesado), enthusiastic (entusiasmado), inspired (inspirado), determined (decidido), active (activo), which are scored according to the frequency with which the subject feels this way, on a 5-point Likert scale. The brief version was chosen due to its proven validity in educational contexts and its efficiency for large sample studies (Flores-Kanter & Medrano, 2018). In previous research, the reliability of the subscales in Rioplatense populations varies between α = .75 to α = .85 (Flores-Kanter & Medrano, 2018; Santángelo et al., 2019).
An open-ended question about Academic Emotions (AE), written in Rioplatense Spanish: Thinking about the last semester, what emotions and moods do you specifically associate with high school? (Pensando en el último semestre, ¿qué emociones y estados de ánimo asociás específicamente al liceo?) This is used to collect emotional vocabulary related to the educational institution; for reasons previously mentioned, this question was only included for students.
Procedure
Participants were invited through institutional means (email, internal groups, educational platforms, classroom invitations and posters) and social media (in the case of teachers) to respond to a self-administered online questionnaire using their own devices. All gave their informed consent, and in the case of underaged participants, consent was also requested from the institution and responsible adults. Contact with students was mediated by the institution, and no data that would allow identification of subjects was collected. In exchange for their participation, institutions obtained a general report on the well-being of their students. The procedures and protocols were approved by the Ethics Committee of the University of Málaga, registry number 152-2022-H.
Data Analysis
The data were explored using descriptive statistics, graphical methods, and Kolmogorov-Smirnov test (K-S). Based on these explorations, non-parametric tests and robust estimators were used. To assess the psychometric properties of the scales, confirmatory factor analysis (CFA) was conducted for each sample, using the models validated by Mikulic et al. (2019) and Flores-Kanter and Medrano (2018). Considering the ordinal nature of the data, their non-normal distribution (Li, 2016; Tarka, 2017), and the precedents established by Caicedo et al. (2018), Santágelo et al. (2019), and Melo et al. (2023), the DWLS (Diagonally Weighted Least Squares) estimator was used in its robust variant WLSMV (Weighted Least Squares Means and Variance adjusted), with CFI (Comparative Fit Index), TLI (Tucker Lewis Index), RMSEA (Root Mean Square Error of Approximation), and SRMR (Standardized Root Mean Square Residual) as fit indices (Rosseel, 2012). The interpretation followed Hu and Bentler (1999) criteria: RMSEA and SRMR < .08 acceptable, < .05 excellent; CFI and TLI > .90 acceptable, > .95 excellent. Cronbach’s alpha coefficients (α) and McDonald’s omega (ω) were calculated, and correlations between scales were determined using Spearman’s rho.
To determine affective profiles, a non-hierarchical cluster analysis (k-means) with k = 4 was conducted, following the model originally proposed by Norlander et al. (2002) and the methodological considerations of García and MacDonald (2023). To explore the validity of the profiles, convergence with a simple yet empirically and theoretically robust method -median-splits- (García & MacDonald, 2023) was assessed, comparing intra-group homogeneity using WSS (Within-Cluster Sum of Squared Errors) value. Kruskal-Wallis tests were conducted to determine whether differences existed between profiles in PA, NA, and SWL, consistent with the literature and theory, using η² as effect size measure (Tomczak & Tomczak, 2014); pairwise comparisons were performed using Dunn’s test with Bonferroni correction (Ogle et al., 2023).
The preceding analyses were carried out for all samples (EMB, EMS, and teachers), whereas the following analyses were conducted only for the EMB and EMS samples, for which open-ended responses regarding EA were available.
To analyze relationships between EA and SWB variables, open-ended responses were processed using a dictionary-based approach (Boyd & Schwartz, 2021), following Silge and Robinson's (2016) procedures. To remove words from undesired grammatical categories —conjunctions, articles, pronouns, etc.— the inventories for Uruguay from CORPES XXI (Real Academia Española, n.d.) and the Spanish stopwords list by Feinerer et al. (2008) were used. The Annotated Dictionary of Emotional Vocabulary (DAVE) (Manchini, Jiménez et al., 2024) was used to compute the proportion of words with positive, negative, and neutral-ambivalent valence. Since students responded only using explicit emotional vocabulary, the proportions of positive/negative/neutral-ambivalent words are directly related; for the sake of simplicity, only the proportion of negative words was used to compute the correlation with SWL, NA, and PA. The distinctive vocabulary of each student profile was explored using the Term Frequency - Inverse Document Frequency (TF-IDF) statistic (Silge & Robinson, 2016) and was graphically represented using word clouds. These analyses were carried out using the procedures developed in R (R Core Team, 2021) by Revelle (2022), Rosseel (2012), Silge and Robinson (2016), and Wickham et al. (2019).
Results
As shown in Table 1, the scales exhibited acceptable values of α and ω, and SWL showed excellent model fit across the three samples, similar to what was reported by Mikulic et al. (2019), Ruiz et al. (2019), and Melo et al. (2023). In the case of PANAS, model fit was excellent for teachers and acceptable for EMS and EMB students.
The correlation analysis showed a weak but significant positive relationship (rho = .11, p = .033) between NA and PA in the EMB sample; it was not significant in the EMS student sample (rho = .01, p = .9) nor in the teacher sample (rho = .09, p = .08).
The correlation with SWL was positive and moderate for PA in the teacher sample (rho = .3, p < .001), EMS students (rho = .36, p < .001), and EMB students (rho = .31, p < .001), while it was negative and moderate for NA in the teacher sample (rho = -.41, p < .001), EMS (rho = -.34, p < .001), and EMB (rho = -.26, p < .001).
Table 1: Descriptive statistics and psychometric properties of scales
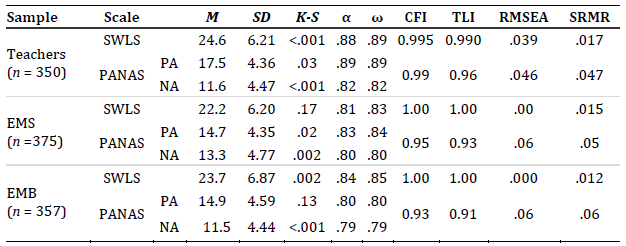
In all three samples (Table 2), cluster analysis produced profiles comparable to the proposed model (García, 2023). To explore these profiles and their relationship with the split-median method —using the median as a cutoff point (García & MacDonald, 2023)— a confusion matrix was generated between both approaches, graphical explorations were conducted, and the agreement percentage was calculated. Quantitative results and graphical exploration suggest that the profiles produced by both methods are equivalent, with a high agreement percentage (78 % in EMB, 88.5 % in EMS, and 78 % in teachers); the WSS calculation for both methods suggests that the profiles generated by k-means are more homogeneous, both for the EMB sample (WSSk-means= 4657.3 , WSSmedian-split= 5168.7), the EMS sample (WSSk-means = 4737.1, WSSmedian-split= 5015.7), and the teacher sample (WSSk-means = 4141.9, WSSmedian-split= 4446.4).
Table 2: Descriptive statistics and pairwise comparison between affective profiles
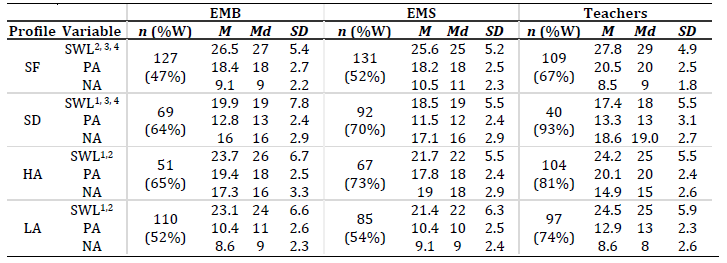
Note: SF: Self-Fulfilling; SD: Self-Destructive; HA: High-Affective; LA: Low-Affective. 1 Significant difference with SF (p < .05 in Dunn's test, w/Bonferroni correction). 2 Significant differences with SD. 3 Significant difference with HA. 4 Significant differences with LA (p < .05 in Dunn's test, w/Bonferroni correction). %W: Percentage of women.
Regarding the differences in NA and PA by affective profile, the Kruskal-Wallis test indicated significant differences in PA scores across profiles in the EMB sample (χ²(df=3) = 269.25, p < .001, η2 = 0.75), EMS (χ²(df=3) = 279.22, p < .001, η2 = 0.74) and Teachers (χ²(df= 3) = 242.36, p < .001, η2 = 0.69). The results for NA were also significant in EMB (χ²(df=3) = 235.49, p < .001, η2 = 0.66), EMS (χ²(df=3) = 277.43, p < .001, η2 = 0.74) and teachers (χ²(df=3) = 253.12, p < .001, η2 = 0.72).
Results suggest significant differences in SWL scores across profiles for EMB (χ²(df= 3) = 39.12, p < .001, η2 = 0.1), EMS (χ²(df= 3) = 73.77, p < .001, η2 = 0.19) and teachers (χ²(df= 3) = 75.36, p < .001, η2 = 0.21). In all samples, pairwise comparison results (Table 2) suggest significant differences in SWL between all profiles except between LA and HA.
After preprocessing, DAVE was able to identify 2,906 (91 %) of the 3,201 words written by students in relation to their educational institution, 1,291 in the EMB sample and 1,615 in the EMS sample. The words not identified (295) were manually reviewed, confirming that they generally corresponded to cases in which students explained the reasons for their associations (“liceo” (school), “deberes” (homework), “compañeros” (classmates), etc.), adverbs (“no,” “muy”), and, in some cases, spelling errors not recognized by DAVE (“felis,” “juzgación,” “triztesa,” “alegradusimo,” “afrijido”) or terms not considered emotional vocabulary (“sueño” (sleepiness)). These results are relevant for considering the inherent noise in quantitative approaches to text analysis (Boyd & Schwartz, 2021). However, as shown in Table 3, in both samples a small proportion of lexical families accounts for a very large proportion of the words used by students, suggesting that these cases likely have minimal influence.
Table 3: Frequently reported Academic Emotions
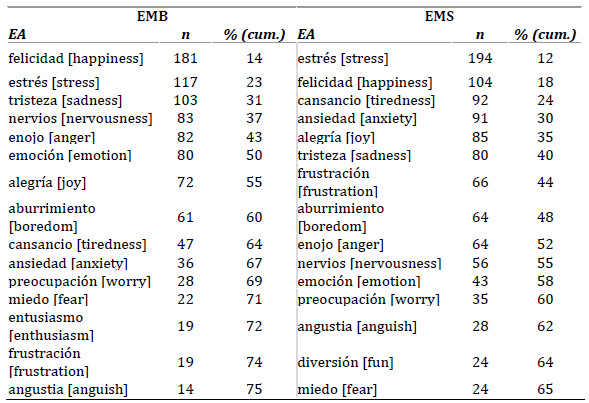
Note: AE: Academic Emotions, normalized with DAVE. n: Students reporting. % (cum.): Cumulative percentage of total words.
It is worth noting that the proportion represented by the 15 most frequent words is lower in the EMS sample, which suggests a broader vocabulary. In both samples, a higher proportion of AE has a negative polarity: in the case of EMB, 53.1% are negative, 8.1 % neutral-ambivalent, and 38.8 % positive, while in EMS, 65.8 % are negative, 5.7 % neutral-ambivalent, and 28.3 % positive.
The correlational analysis suggests that the proportion of negative terms is significantly correlated with AN, AP, and SWL, both for EMS and EMB. In EMS, the proportion of negative terms showed positive correlations with AN (rho = .211, p < .001) and negative correlations with AP (rho = ‑.238, p < .001) and SWL (rho = -.257, p < .001). The EMB sample showed similar results: the proportion of negative terms correlated positively with AN (rho = .212, p < .001) and negatively with AP (rho = -.220, p < .001) and SWL (rho = -.288, p < .001).
The analysis of distinctive vocabulary suggests the existence of specific affective associations for each of the profiles (Figure 2). The words with the highest TF-IDF values (exact values in parentheses) for each of the profiles were:
-SF profile: for the EMS sample, “interés” (interest) (.029), “motivación” (motivation) (.026), “tranquilidad” (calmness) (.021), and “empatía” (empathy) (.018); for the EMB sample, “curiosidad” (curiosity) (.016), “contento” (content/happy) (.010), “creatividad” (creativity) (.010), and “satisfacción” (satisfaction) (.010).
-SD profile: for the EMS sample, “soledad” (loneliness) (.034), “desesperación” (despair) (.021), “presión” (pressure) (.019), and “confusión” (confusion) (.017); for the EMB sample, “decepción” (disappointment) (.020), “desagrado” (displeasure) (.020), “desinterés” (disinterest) (.020), and “mal” (bad) (.020).
-LA profile: for the EMS sample, “fiaca” (laziness/sluggishness) (.039), “agobio” (overwhelm) (.019), “orgullo” (pride) (.013), “pereza” (laziness) (.013); for the EMB sample, “tranquilidad” (calmness) (.018), “presión” (pressure) (.014), “soledad” (loneliness) (.014), and “bien” (well) (.012).
-HA profile: for the EMS sample, “impotencia” (helplessness) (.027), “desorientación” (disorientation) (.022), “presión” (pressure) (.019), and “agotamiento” (exhaustion) (.017); for the EMB sample, “confusión” (confusion) (.028), “inseguridad” (insecurity) (.021), “interés” (interest) (.021), and “pereza” (laziness) (.021).
Figure 2: Distinctive Academic Emotions for each profile in EMB (left) y EMS (right) samples
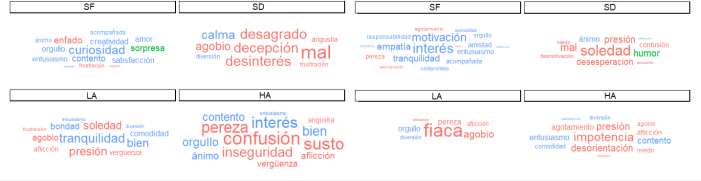
Note: Size indicates TF-IDF value; color, the polarity of the word in DAVE: negative (red), positive (blue) or neutral-ambivalent (green). Words are presented in their original language; the translations of the words in each wordcloud are presented by decreasing size. For EMB sample (left), SF profile: curiosity, contentment, creativity, anger, satisfaction, surprise, pride, enthusiasm, accompanied and love; SD profile: disappointment, disgust, disinterest, bad, overwhelm, calmness, anguish, fun, frustration; LA profile: tranquility, pressure, loneliness, well, overwhelm, kindness, comfort, distress, shame; HA profile: confusion, insecurity, interest, laziness, fright, well, contentment, pride, distress, shame, mood, anguish, enthusiasm. For EMS (right) sample, SF profile: interest, motivation, tranquility, empathy, enthusiasm, companionship, friendship, responsibility, laziness, exhaustion, pride, commitment, comfort; SD profile: loneliness, despair, pressure, confusion, mood, bad, lack of motivation, fear; LA profile: laziness ("fiaca", rioplatense Spanish slang), overwhelm, pride, laziness, distress, fun; HA profile: powerlessness, disorientation, pressure, exhaustion, enthusiasm, content, distress, comfort, fear, overwhelm and fun.
Discussion
This study aimed to analyze, within the Uruguayan educational context, the properties of two instruments that assess SWB, identify affective profiles, and explore students' AE. Although more evidence is desirable, the overall results suggest that SWLS and PANAS are valid instruments for assessing SWB, and that their use in conjunction with the affective profiles model and the analysis of open-ended responses allows for a reasonable representation of affective trends and experiences in academic settings.
Psychometric properties of the scales
SWLS showed excellent properties across all samples, equivalent to those found in Río de la Plata populations (Mikulic et al., 2019) and in other regions (Pavot & Diener, 2008). The correlations between this scale and PANAS, significant but moderate, are consistent with the literature (Pavot & Diener, 2008). For PANAS, reliability indicators were acceptable, and the CFA —with the orthogonal model originally proposed by Watson et al. (1998)— showed excellent fit indices for teachers and acceptable ones for students. In line with previous findings from the Río de la Plata region (Caicedo et al., 2018; Flores-Kanter & Medrano, 2018; Santángelo et al., 2019) and other regions (García, 2023), the results indicate that the short version of PANAS may be a useful tool for the independent assessment of NA and PA. The indicators suggest a less optimal performance in the younger student sample; in samples mostly composed of young students, it may be advisable to use alternative versions of PANAS (Brunet et al., 2024) or, if using this version, to interpret its results with caution. Moreover, this highlights the need to consider developmental aspects of SWB across the life cycle.
The correlation between PA and NA —non-significant in teachers and EMS, and significant and positive in EMB— is consistent with previous studies suggesting that PA and NA may not be completely independent (e.g., Caicedo et al., 2018). From a broader perspective, these results are consistent with the proposal that, since PA and NA are part of a dynamic adaptive meta-system, it is desirable to combine variable-oriented approaches with person-oriented ones—such as the affective profiles model (García, 2023; Schütz et al., 2013).
Affective profiles
The intrinsic properties of the PANAS scale —namely the dispersion of total scores and the absence of correlation between subscales— result in the potential to identify four profiles. The results from graphical explorations, quantitative analysis, and language analysis suggest that this model, proposed by Norlander et al. (2002), is a reasonable way to represent affective trends and experiences of secondary education students and teachers, with a focus on the person.
To identify the profiles, cluster analysis proved to be more appropriate than the median-split method, both for theoretical reasons, as it focuses on similarities between individuals rather than on central tendency measures of the variable, and for empirical reasons, as it showed greater within-group homogeneity. However, the high agreement rates (similar to those reported by García et al., 2015) suggest that the median-split method should not be dismissed as less reliable (García & MacDonald, 2023). In turn, this convergence also increases the reliability of aligning the clusters obtained through k-means with the four-affective-profile model.
As expected, significant differences in SWL were observed between the SF and SD profiles; however, no differences were found between the LA and HA profiles in any of the samples; these profiles showed significantly higher SWL scores than the SD profile, but lower than the SF profile. Although consistent with the trend of the SF, HA, and LA profiles to have high SWL (García, 2023), these results differ from those of García and MacDonald (2023) in the US, who found differences between HA and LA but not between SF and HA. Considering the cognitive and reflective nature of LS, it seems reasonable to hypothesize that these differences may stem from cultural differences regarding which affective experiences are typically deemed compatible with a satisfying life. Just as the US accepts and validates traits associated with the HA profile (García & MacDonald, 2023), it is plausible that a culture like Uruguay’s —which is stereotyped as “measured and calm” (Pais, 2019), “family-oriented,” “complaining,” “nostalgic,” “lazy,” and “traditionalist” (Pérez, 2007)— may be more inclined than the American one to relativize the value of positive experience and to consider a life with low affectivity as satisfying.
The lower proportion of female participants observed in the SF and LA profiles is consistent with previous findings (Adrianson, 2023; García et al., 2015; Sagone et al., 2023). However, as García and MacDonald (2023) point out, it is more plausible that affectivity is not related to gender per se, but rather to how individual differences —such as personality— are encoded according to a person's gender. Given the relevance of gender stereotypes in the construction of identity —particularly in the affective domain (Manchini & Martínez, 2025)— it is necessary to conduct studies that examine this variable in detail, investigating not only the various ways of expressing a masculine or feminine identity, but also the identities of non-binary, trans and queer individuals, inter alia.
Academic emotions
Previous studies, such as those by García et al. (2016) and García & Sikström (2023), suggest the possibility of incorporating language measures into the discussion on affective profiles, particularly by using texts generated directly in relation to the psychological phenomenon of interest. The results of this study show that this approach is fruitful: it not only found a distinctive use of vocabulary (García et al., 2016), consistent with theory (García, 2023), but also that this vocabulary also qualitatively illustrates the experience of students from each profile.
In quantitative terms, the results are consistent with previous findings (e.g., Wong et al., 2024; Zalazar-Jaime et al., 2022) in suggesting that SWB is related to AE, or more precisely in this case, to the positive/negative polarization of students’ reports (i.e., the proportion of AE with negative valence). Although predictable, this is still a relevant finding for practice: when thinking about well-being in the educational context in a situated way, alongside sociopolitical and institution-specific factors, one must also consider person-related factors (Dávila et al., 2024).
In qualitative terms, given that emotional vocabulary conveys diverse information about experience (Cochrane, 2009; Soriano, 2016), the report can be used as a window into different ways of experiencing the educational institution. For example, students in the SD profile are distinguished by more frequent reports of unpleasant emotions; but beyond valence, words such as loneliness, disinterest, lack of motivation, disappointment, pressure, and despair point to an experience of repulsion (vs. attraction), of weakness and uncertainty (vs. power and predictability), and of social disconnection (Cochrane, 2009). In contrast, students from the SF profile are characterized by reporting positively valenced emotions that indicate attraction (such as curiosity, motivation, interest, and enthusiasm), power (such as pride, responsibility, and creativity), predictability (such as calmness, satisfaction, and contentment), and social connection (such as empathy, friendship, companionship and love). As theoretically expected (García, 2023), the results for the LA and HA profiles are varied; however, it stands out that in both samples, the distinctive vocabulary of the HA profile appears to point to an experience of weakness and uncertainty (confusion, insecurity, powerlessness, fright, and fear).
Overall, these results suggest that combining brief scales with open-ended questions is a valid and efficient way to obtain situated information about well-being in educational settings. Integrating them into systems that routinely assess psychoeducational variables (e.g., Zenteno-Osorio & Leal-Soto, 2023) would allow institutions to access relevant feedback about their functioning. Responsibly monitoring and understanding well-being dynamics supports the development of informed and targeted actions at the personal, institutional, and sociopolitical levels (Dávila et al., 2024). For example, interventions aimed at addressing emotional regulation strategies at the personal level (Body et al., 2016; Salcido-Cibrián et al., 2019; Schmitz, 2024; Stockinger et al., 2025) can be more effectively targeted if the diversity of affective profiles is taken into account: it is expected that individuals will benefit from different types of practices and resources depending on their profile.
At institutional level, using students’ own emotional vocabulary provides insight into the cognitive component of the academic experience, going beyond positive and negative affect (Soriano, 2016). For example, references to experiences of anxiety, stress, and tiredness not only communicate a negative experience, but also suggest that the educational institution is perceived as an unappealing environment that generates feelings of powerlessness, lack of control, and disconnection from others. This can serve as a guide for implementing educational interventions —both inside and outside the classroom (Manchini, Mels et al., 2024)— as well as for fostering the development of classroom-based and institution-based interventions that specifically address the identified emotions.
Finally, at the social and political level, it is especially important to have resources that represent students’ emotions in their own words, thereby avoiding biased portrayals driven by interests external to those of the subjects of education (Palacios-Díaz et al., 2023); for instance, in Uruguay, such bias has been documented in emotional educations projects promoted by conservative sectors (Palacios-Díaz et al., in press).
Well-being and emotional experience lie at the core of the educational project; the tools and models proposed, while limited and in need of refinement, allow us to attend to them in a rigorous manner.
Limitations and future directions
In addition to limitations inherent to the used methods, this study has several specific limitations. First, the cross-sectional design does not allow for the study of well-being development throughout adolescence, or the establishment of relevant causal relationships (e.g., between SWB and AE); likewise, the intentional nature of the sample raises questions about the generalizability of these results. In this regard, it would be advisable to move toward longitudinal studies with representative samples. Second, to confirm the validity of the scales more thoroughly, it would be desirable to include additional measures (e.g., of eudaimonic well-being or mental health, which would allow for the assessment of convergent and divergent validity); it would also be desirable to analyze test-retest reliability. Third, although this study includes both teachers and students, the design does not allow for addressing interesting questions about interactions between these groups (e.g., whether teachers’ SWB influences students’ SWB or AE). Finally, it is worth noting that many of these variables could have interesting relationships with data that institutions themselves generate and record about their students (grades, attendance, participation in activities, sociograms, sociodemographic data, etc.). Linking these measures is necessary in order to advance models that account for well-being in educational contexts and to design interventions that actively promote it.
Conclusions
In a context where well-being is becoming increasingly central, this work provides evidence and assessment resources that support advances in research and guide systematic actions to promote it among students and teachers. In addition to validating frequently used scales, it integrated a person-centered model of affective profiles and techniques of quantitative language analysis, allowing for a more contextualized view of affective experience in the educational setting. Both questionnaires and language open a window into experience in educational contexts, enabling a more thorough understanding of their dynamics. Having evidence and tools to address well-being allows for approaching some of education’s perennial challenges —such as student retention, motivation, and teacher-student relationships— from new perspectives. It also allows educational institutions to systematically approach the most general of goals: the good living.
References
Adrianson, L. (2023). Affective profiles, health, and well-being in Indonesia. In D. García (Ed.), The affective profiles model (pp. 175-190). Springer. https://doi.org/10.1007/978-3-031-24220-5_2
Ahmed, S. (2021). La promesa de la felicidad. Caja negra.
Anselmi, A., Cracco, C., Estradé, A., Solmi, M., & Correll, C. U. (2024). Impactos de la pandemia de COVID-19 sobre el bienestar y la salud mental de adultos uruguayos. Ciencias Psicológicas, 18(2), e-4059. https://doi.org/10.22235/cp.v18i2.4059
Body, L., Ramos, N., Recondo, O., & Pelegrina, M. (2016). Desarrollo de la inteligencia emocional a través del programa mindfulness para regular emociones (PINEP) en el profesorado. Revista Interuniversitaria de Formación del Profesorado, 30(87), 47-59.
Boyd, R., & Schwartz, H. (2021). Natural language analysis and the psychology of verbal behavior: The past, present, and future states of the field. Journal of Language and Social Psychology, 40(1), 1-21. https://doi.org/10.1177/0261927X20967028
Bravo-Sanzana, M., Casas, F., Rodríguez-Rivas, M. E., Oriol, X., Varela, J. J., Miranda, R., & Terán-Mendoza, O. (2025). Instruments for measuring hedonic and eudaimonic well-being of adolescents in the Latin American school contexts: A systematic review. Child Indicators Research, 18(3), 955-1000. https://doi.org/10.1007/s12187-025-10231-z
Brown, J. L. D., & Potter, S. (2024). Integrating the philosophy and psychology of well-being: An opinionated overview. Journal of Happiness Studies, 25(5). https://doi.org/10.1007/s10902-024-00763-6
Brunet, N., Tórtora, G., Suñol, N., & Fernández-Berrocal, P. (2024). Evaluación de la aplicación del Positive and Negative Affect Schedule (PANAS-N) para adolescentes uruguayos en contextos de vulnerabilidad social. In V. Ortuño (moderador), Simposio de desarrollo y adaptación de instrumentos de evaluación psicológica en el Uruguay. VI Simposio de Investigación en Psicología, Universidad Católica del Uruguay, Montevideo, Uruguay.
Caicedo, E., Michelini, Y., Belaus, A., Mola, D. J., Godoy, J. C., & Reyna, C. (2018). Further considerations regarding PANAS: Contributions from four studies with different Argentinean samples. Suma Psicológica, 25(2), 133-145. https://doi.org/10.14349/sumapsi.2018.v25.n2.5
Camacho, J., Slemp, G.R., Pekrun, R., Loderer, K., Hou, H., & Oades, L. (2021). Activity achievement emotions and academic performance: A meta-analysis. Educational Psychology Review, 33(4), 1051-1095. https://doi.org/10.1007/s10648-020-09585-3
Camps, V. (2019). La búsqueda de la felicidad. Arpa.
Carrizo L. (2021). Salud mental en Uruguay en época de COVID 19. Informe de Estado de Situación, (4). Academia Nacional de Ciencias del Uruguay. https://anciu.org.uy/risep/serie-estados-de-situacion-risep.html
Chiarino, N., Curione, K., & Huertas Martinez, J. A. (2024). Clima motivacional de clase en la enseñanza media y superior iberoamericana: una revisión sistemática. Ciencias Psicológicas, 18(2), e-3770. https://doi.org/10.22235/cp.v18i2.3770
Cochrane, T. (2009). Eight dimensions for the emotions. Social Science Information, 48(3), 379-420. https://doi.org/10.1177/0539018409106198
Crisp, R. (2017). Well-Being. In E. N. Zalta (Ed.), The Stanford Encyclopedia of Philosophy. https://plato.stanford.edu/archives/fall2017/entries/well-being
Cunsolo, S. (2017). Subjective wellbeing during adolescence: a literature review on key factors relating to adolescents’ subjective wellbeing and education outcomes. Studi Sulla Formazione, 20(1), 81-94. https://doi.org/10.13128/Studi_Formaz-20941
Curren, R., Boniwell, I., Ryan, R. M., Oades, L., Brighouse, H., Unterhalter, E., Kristjánsson, K., De Ruyter, D., Macleod, C., Morris, I., & White, M. (2024). Finding consensus on well-being in education. Theory and Research in Education, 22(2), 117-157. https://doi.org/10.1177/14778785241259852
Dávila, J. R., Huertas, J. A., & Leal-Soto, F. (2024). Estructura psicológica del bienestar docente: justificación de un modelo situado. Revista de Psicodidáctica, 29(1), 19-27. https://doi.org/10.1016/j.psicod.2023.11.001
Diener, E. (1994). Bienestar subjetivo. Intervención Psicosocial, 3(8), 67-113.
Diener, E., Emmons, R. A., Larsen, R. J., & Griffin, S. (1985). The Satisfaction with Life Scale. Journal of Personality Assessment, 49(1), 71-75. https://doi.org/10.1207/s15327752jpa4901_13
Diener, E., Heintzelman, S. J., Kushlev, K., Tay, L., Wirtz, D., Lutes, L. D., & Oishi, S. (2017). Findings all psychologists should know from the new science on subjective well-being. Canadian Psychology, 58(2), 87-104. https://doi.org/10.1037/cap0000063
Feinerer, I., Hornik, K., & Meyer, D. (2008). Text mining infrastructure in R. Journal of Statistical Software, 25(5), 1-54. https://doi.org/10.18637/jss.v025.i05
Feldman-Barrett, L., & Bliss-Moreau, E. (2009). Affect as a psychological primitive. Advances in Experimental Social Psychology, 41, 167-218. https://doi.org/10.1016/S0065-2601(08)00404-8
Fernandes, R., & Araujo, N. (2018). Bienestar subjetivo de niños/as y adolescentes: revisión integradora. Ciencias Psicológicas, 12(2), 249-260. https://doi.org/10.22235/cp.v12i2.1689
Fernández, M. E., Castelluccio, L., Sanjurjo, I., & Daset, L. (2024). Adolescent and parental risk perception of alcohol and marijuana use and well-being of adolescents in Uruguay. In M. Florence, W. Vanderplasschen, M. Yu, J. De Maeyer & S. Savahl (Eds.), Handbook of Addiction, Recovery and Quality of Life. International Handbooks of Quality-of-Life (pp. 435-446). Springer. https://doi.org/10.1007/978-3-031-65873-0_30
Flores-Kanter, P. E., & Medrano, L. A. (2016). El afecto y sus dimensiones: Contrastes de modelos ortogonales y oblicuos mediante análisis factorial confirmatorio de la escala PANAS. LIBERABIT, 22(2), 173-184. https://doi.org/10.24265/liberabit.2016.v22n2.05
Flores-Kanter, P. E., & Medrano, L. A. (2018). Comparación de dos versiones reducidas de la Escala PANAS: Análisis factoriales en una muestra argentina. Revista Iberoamericana de Diagnóstico y Evaluación, 49(4), 37-46. https://doi.org/10.21865/ridep49.4.03
Fondo de las Naciones Unidas para la Infancia. (2022). Situación de bienestar psicosocial y salud mental en adolescentes y jóvenes en Uruguay. https://bibliotecaunicef.uy/documentos/267_Situacion%20de%20bienestar%20psicosocial%20salud%20mental%20adolescentes%20Uruguay.pdf
Gallup. (2024). Gallup Global Emotions Report 2024.
García, D. (2023). The story of the affective profiles model: Theory, Concepts, Measurement, and Methodology. En: D. García (Ed.), The affective profiles Model (pp. 3–23). Springer. https://doi.org/10.1007/978-3-031-24220-5_1
García, D., & MacDonald, S. (2023). The (mis)measurement of the affective profiles model: Should I split or should I cluster? In D. García (Ed.), The affective profiles model (pp. 25-48). Springer. https://doi.org/10.1007/978-3-031-24220-5_2
García, D., & Sikström, S. (2023). Innovative methods for affectivity profiling: Quantitative semantics. In D. García (Ed.), The affective profiles model (pp. 89-104). Springer. https://doi.org/10.1007/978-3-031-24220-5_4
García, D., Kjell, O. N. E., & Sikström, S. (2019). A collective picture of what makes people happy: Words representing social relationships, not money, are recurrent with the word ‘happiness’ in online newspapers. In P. Benson, B. Dalmaso, & I. Stefan (Eds.), The psychology of social networking Vol. 2: Identity and relationships in online communities (pp. 4-16). De Gruyter Open Poland. https://doi.org/10.1515/9783110473858-003
García, D., Kjell, O. N. E., Sikström, S., & Archer, T. (2016). Using language and affective profiles to investigate differences between individuals. Clinical and Experimental Psychology, 2(2), 123. https://doi.org/10.4172/2471-2701.1000123
Garcia, D., MacDonald, S., & Archer, T. (2015). Two different approaches to the affective profles model: Median splits (variable-oriented) and cluster analysis (person-oriented). PeerJ, 3, e1380. https://doi.org/10.7717/peerj.1380
García-Álvarez, D., Hernández, J., Espinosa, J., & Soler, M. (2020). Validación de la escala de bienestar psicológico para jóvenes de Casullo en adolescentes montevideanos. Revista Latinoamericana de Hipertensión, 15(5), 1-12. https://doi.org/10.5281/zenodo.4487296
Hu, L., & Bentler, P. M. (1999). Cutoff criteria for fit indexes in covariance structure analysis: Conventional criteria versus new alternatives. Structural Equation Modeling, 6, 1-55. https://doi.org/10.1080/10705519909540118
Huertas, J. A. (2012). Los efectos de los afectos en la motivación y la autorregulación. Ciencias Psicológicas, 6(1), 45-55. https://doi.org/10.22235/cp.v6i1.62
Instituto Nacional de Evaluación Educativa. (2020). Estudio de salud ocupacional docente.
Instituto Nacional de Evaluación Educativa. (2023a). Informe sobre el estado de la educación en Uruguay 2021-2022.
Instituto Nacional de Evaluación Educativa. (2023b). Aristas 2022: Informe de Resultados de Educación Media.
Lei, H., Cui, Y., & Chiu, M. M. (2018). The Relationship between Teacher Support and Students' Academic Emotions: A Meta-Analysis. Frontiers in Psychology, 8, 2288. https://doi.org/10.3389/fpsyg.2017.02288
Li, C. (2016). Confirmatory factor analysis with ordinal data: Comparing robust maximum likelihood and diagonally weighted least squares. Behavioral Research Methods 48, 936-949. https://doi.org/10.3758/s13428-015-0619-7
Manchini, N., & Martínez, M. (2025). “Basta que me enamores –o que me mandes flores”: género, experiencia y emociones en el corpus del pop-rock en español. Archiv für Textmusikforschung, 9(1), 1-21. https://doi.org/10.15203/ATeM_2025_1.7
Manchini, N., Jiménez, O., Ramos-Díaz, N., & Trías, D. (2024). Affect and words: An instrument for the quantitative analysis of emotional vocabulary in open-ended responses. https://doi.org/10.31234/osf.io/tmnxw
Manchini, N., Mels, C., & Lacruz, N. (2024). Educar en habilidades emocionales en Uruguay. In C. Mels, M. Báez & N. Lacruz (Coords.), ¿Cómo educar en habilidades socioemocionales? (pp. 135-143). Universidad Católica del Uruguay.
Medrano, L., Flores, P, Trógolo, M. Curarello, A., & González, J. (2015). Adaptación de la Escala de Afecto Positivo y Negativo (PANAS) para la población de estudiantes universitarios de Córdoba. Anuario de investigaciones de la Facultad de Psicología, 2(1), 22-36.
Melo, G., Dias, C. L., Ramos, I. A., Brandão, M., & Winckler, C. (2023). Psychometric properties of the Satisfaction with Life Scale in Brazilian Para athletes. Cuadernos de Psicología del Deporte, 23(2), 133-145. https://doi.org/10.6018/cpd.530191
Mels, C., De Lema, S., & Irigoyen, M. (2024). Bienestar docente en Uruguay: una exploración desde la perspectiva de docentes de educación primaria y media. Agencia Nacional de Investigación e Innovación, Universidad Católica del Uruguay, Administración Nacional de Educación Pública.
Mikulic, I. M., Crespi, M., & Caballero, R. Y. (2019). Escala de Satisfacción con la Vida (SWLS): Estudio de las propiedades psicométricas en adultos de Buenos Aires. Anuario de Investigaciones Facultad de Psicología de la UBA, 27, 395-402.
Norlander, T., Bood, S.-Å., & Archer, T. (2002). Performance during stress: Affective personality, age, and regularity of physical exercise. Social Behavior and Personality: An International Journal, 30(5), 495-508. https://doi.org/10.2224/sbp.2002.30.5.495
Ogden, J., & Lo, J. (2011). How meaningful are data from Likert scales? An evaluation of how ratings are made and the role of the response shift in the socially disadvantaged. Journal of Health Psychology, 17(3), 350-361. https://doi.org/10.1177/1359105311417192
Ogle, D., Doll, J., Wheeler, A., & Dinno, A. (2023). FSA: Simple Fisheries Stock Assessment Methods. R package version 0.9.5 (Software). https://CRAN.R-project.org/package=FSA
Pais, A. (2019, 13 de febrero). ¿Es cierto que los uruguayos son "todos buenos" (y qué tienen que ver los argentinos con ese estereotipo)? BBC News Mundo. https://www.bbc.com/mundo/noticias-47148158
Palacios-Díaz, D., Dufraix, I., Sisto, V., & Ramírez, L. (2023). Conteniendo afectos: análisis discursivo de orientaciones educativas en Chile. Cadernos de Pesquisa, 53(1). https://doi.org/10.1590/1980531410053
Palacios-Díaz, D., Manchini, N., & Báez, T. (in press). Legislar las emociones: Análisis discursivo de proyectos de ley sobre educación emocional en Chile y Uruguay. Archivos Analíticos de Políticas Educativas.
Papamitsiou, Z., & Economides, A. A. (2014). Learning analytics and educational data mining in practice: A systematic literature review of empirical evidence. Educational Technology y Society, 17(4), 49-64.
Pavot, W., & Diener, E. (2008). The Satisfaction with Life Scale and the emerging construct of life satisfaction. The Journal of Positive Psychology, 3(2), 137-152. https://doi.org/10.1080/17439760701756946
Pekrun, R. (2016). Using self-report to assess emotions in education. Methodological Advances in Research on Emotion and Education, 43-54. https://doi.org/10.1007/978-3-319-29049-2_4
Pekrun, R., Marsh, H. W., Elliot, A. J., Stockinger, K., Perry, R. P., Vogl, E., Goetz, T., Van Tilburg, W. A. P., Lüdtke, O., & Vispoel, W. P. (2023). A three-dimensional taxonomy of achievement emotions. Journal of Personality and Social Psychology, 124(1), 145-178. https://doi.org/10.1037/pspp0000448
Pérez, P. (2007). Identidades, actitudes y estereotipos nacionales y supranacionales en una muestra uruguaya. Ciencias Psicológicas, 1(1), 81-102. https://doi.org/10.22235/cp.v0i1.574
Portela, M. (2021). Estudio preliminar de las propiedades psicométricas de la escala de funcionamiento psicológico positivo para una muestra de adolescentes uruguayos. Ciencias Psicológicas, 15(1), e-2396. https://do i.org/10.22235/cp.v15i1.2396
R Core Team. (2021). R: A language and environment for statistical computing (Software). R Foundation for Statistical Computing. https://www.R-project.org/.
Real Academia Española. (s.f.). Corpus del Español del siglo XXI (CORPES). Recuperado el 23 de junio de 2024, de https://www.rae.es/corpes/
Revelle, W. (2022). psych: Procedures for psychological, psychometric, and personality research (R package version 2.2.9) (Software). https://CRAN.R-project.org/package=psych
Rivera-Vargas, P., & Oyanedel, J. C. (2023). Subjective well-being in online and mixed educational settings. Frontiers in Psychology, 14, 1152373. https://doi.org/10.3389/fpsyg.2023.1152373
Rosseel, Y. (2012). lavaan: An R Package for Structural Equation Modeling. Journal of Statistical Software, 48(2), 1-36. https://doi.org/10.18637/jss.v048.i02
Rowan, A. N. (2022). World happiness report 2022. WellBeing News, 4(3), 2.
Ruiz, F. J., Suárez-Falcón, J. C., Flórez, C. L., Odriozola-González, P., Tovar, D., López-González, S., & Baeza-Martín, R. (2019). Validity of the Satisfaction with Life Scale in Colombia and factorial equivalence with Spanish data. Revista Latinoamericana de Psicología, 51(2), 58-65. https://doi.org/10.14349/rlp.2019.v51.n2.1
Ryan, R. M., & Deci, E. L. (2001). On happiness and human potentials: A review of research on hedonic and eudaimonic well-being. Annual Review of Psychology, 52, 141-166. https://doi.org/10.1146/annurev.psych.52.1.141
Sagone, E., & De Caroli, M. (2023). Affectivity and well-being in Italian samples of adolescents and young adults. In D. García (Ed.), The affective profiles model (pp. 191–205). Springer. https://doi.org/10.1007/978-3-031-24220-5_11
Sagone, E., De Caroli, M., & Indiana, M. (2023). Differences in procrastination, well-being, and average grades in exams among Italian university students with different affective profiles. In D. García (Ed.), The affective profiles model (pp. 207-224). Springer. https://doi.org/10.1007/978-3-031-24220-5_12
Salcido-Cibrián, L. J., Ramos, N. S., Jiménez, Ó., & Blanca, M. J. (2019). Mindfulness to regulate emotions: The Mindfulness and Emotional Intelligence Program (PINEP) and its adaptation to a virtual learning platform. Complementary Therapies in Clinical Practice, 36, 176-180. https://doi.org/10.1016/j.ctcp.2019.07.003
Santángelo, P. R., Brandariz, R., Cremonte, M., & Conde, K. (2019). Nuevas evidencias de las propiedades psicométricas del PANAS en población estudiantil argentina. Revista Argentina de Clínica Psicológica, 28(5), 752-760. https://doi.org/10.24205/03276716.2019.1118
Schmitz, B. (2024). What teachers can do to enhance students’ well-being: Discussion. Learning and Instruction, 94, 101980. https://doi.org/10.1016/j.learninstruc.2024.101980
Schütz, E., Sailer, U., Al Nima, A., Rosenberg, P., Andersson Arntén, A.-C., Archer, T., & García, D. (2013). The affective profiles in the USA: Happiness, depression, life satisfaction, and happiness-increasing strategies. PeerJ, 1, e156. https://doi.org/10.7717/peerj.156
Silge, J., & Robinson, D. (2016). tidytext: Text mining and analysis using tidy data principles in R. Journal of Open Source Software, 1(3). https://doi.org/10.21105/joss.00037.
Soriano, C. (2016). El lenguaje de las emociones. In M. C. Horno Chéliz, I. Ibarretxe Antuñano & J. L. Mendívil Giró (Eds.), Panorama actual de la ciencia del lenguaje (pp. 243-259). Prensas de la Universidad de Zaragoza.
Stockinger, K., Dresel, M., Marsh, H., & Pekrun, R. (2025). Strategies for Regulating Achievement Emotions: Conceptualization and Relations with University Students’ Emotions, Well-Being, and Health. PsyArXiv. https://doi.org/10.31234/osf.io/egm2p_v2
Tan, J., Mao, J., Jiang, Y., & Gao, M. (2021). The influence of academic emotions on learning effects: A systematic review. International Journal of Environmental Research and Public Health, 18(18), 9678. https://doi.org/10.3390/ijerph18189678
Tarka, P. (2017). The comparison of estimation methods on the parameter estimates and fit indices in SEM model under 7-point Likert scale. Archives of Data Science, 2(1). https://doi.org/10.5445/KSP/1000058749/10
Tomczak, M., & Tomczak, E. (2014). The need to report effect size estimates revisited: An overview of some recommended measures of effect size. Trends in Sport Sciences, 21(1), 19-25.
Vine, V., Boyd, R. L., & Pennebaker, J. W. (2020). Natural emotion vocabularies as windows on distress and well-being. Nature Communications, 11(1), 4525. https://doi.org/10.1038/s41467-020-18349-0
Watson, D., Clark, L. A., & Tellegen, A. (1988). Development and validation of brief measures of positive and negative affect: the PANAS scales. Journal of Personality and Social Psychology, 54(6), 1063-1070. https://doi.org/10.1037//0022-3514.54.6.1063
Wickham, H., Averick, M., Bryan, J., Chang, W., McGowan, L., François, R., Grolemund, G., Hayes, A., Henry, L., Hester, J., Kuhn, M., Pedersen, T., Miller, E., Bache, S., Müller, K., Ooms, J., Robinson, D., Seidel, D., Spinu, V., … Yutani, H. (2019). Welcome to the tidyverse. Journal of Open Source Software, 4(43), 1686.
Wong, Z. Y., Liem, G. A. D., Chan, M., & Datu, J. A. D. (2024). Student engagement and its association with academic achievement and subjective well-being: A systematic review and meta-analysis. Journal of Educational Psychology, 116(1), 48-75. https://doi.org/10.1037/edu0000833
World Health Organization & United Nations Children's Fund. (2021). Investing in our future: A comprehensive agenda for the health and well-being of children and adolescents. https://iris.who.int/bitstream/handle/10665/350239/9789240037793-eng.pdf?sequence=1&isAllowed=y
Zalazar-Jaime, M. F., Moretti, L. S., & Medrano, L. A. (2022). Contribution of academic satisfaction judgments to subjective well-being. Frontiers in Psychology, 13, 772346. https://doi.org/10.3389/fpsyg.2022.772346
Zenteno-Osorio, S., & Leal-Soto, F. (2023). Transfer of an information system and monitoring of psychological well-being in educational contexts: A collaborative experience between a research center and schools in the Tarapacá region – Chile. Praxis Educativa, 27(1), 1-22. https://doi.org/10.19137/praxiseducativa-2023-270120
Zhou, J., & Ye, J. (2020). Sentiment analysis in education research: a review of journal publications. Interactive Learning Environments, 31(3), 1252-1264. https://doi.org/10.1080/10494820.2020.1826985
Data availability: Data, analytical codes, and supplementary materials are available on the Open Science Framework (https://www.doi.org/10.17605/OSF.IO/N4PJ2).
Funding: This study received financial support from the National Agency for Research and Innovation of Uruguay, through the project POS_EXT_2021_1_172077.
Conflict of interest: The authors declare that they have no conflicts of interest.
How to cite: Manchini, N., Trías Seferian, D., Jiménez, O., & Ramos-Díaz, N. (2025). Subjective Well-Being of Students and Teachers in Uruguay: Life Satisfaction, Affective Profiles and Academic Emotions. Ciencias Psicológicas, 19(2), e-4401. https://doi.org/10.22235/cp.v19i2.4401
Authors’ contribution (CRediT Taxonomy): 1. Conceptualization; 2. Data curation; 3. Formal Analysis; 4. Funding acquisition; 5. Investigation; 6. Methodology; 7. Project administration; 8. Resources; 9. Software; 10. Supervision; 11. Validation; 12. Visualization; 13. Writing: original draft; 14. Writing: review & editing.
N. M. has contributed in 1, 2, 3, 4, 5, 6, 7, 8, 9, 11, 12, 13, 14; D. T. S. in 1, 3, 4, 5, 6, 7, 8, 10, 11, 12, 13, 14; O. J. in 4, 5, 7, 8, 10, 11, 12, 14; N. R. D. in 4, 5, 7, 8, 10, 11, 12, 14.
Scientific editor in-charge: Dr. Cecilia Cracco.
Ciencias Psicológicas; v19(2)
julio-diciembre 2025
10.22235/cp.v19i2.4401
Artículos Originales