10.22235/cp.v18i1.3498
Adaptación y análisis de la estructura interna de la Escala de Sentido de Pertenencia Universitaria (ESPU) en estudiantes peruanos
Adaptation and Analysis of the Internal Structure of the Sense of Belonging at University Scale (SBUS) in Peruvian Students
Adaptação e análise da estrutura interna da Escala de Pertencimento à Universidade (ESPU) em estudantes peruanos
Jossué Correa-Rojas1, ORCID 0000-0002-4166-7210
Mirian Grimaldo2, ORCID 0000-0003-4197-1906
Paloma Valdivia-Vizarreta3, ORCID 0000-0003-1499-5478
Monica Del Aguila-Chávez4, ORCID 0000-0001-7538-7519
1 Universidad Peruana de Ciencias Aplicadas, Perú, [email protected]
2 Universidad Peruana de Ciencias Aplicadas, Perú
3 Universidad Autónoma de Barcelona, España
4 Universidad Marcelino Champagnat, Peú
Resumen:
El sentido de pertenencia hace referencia a la experiencia de participación en un sistema o entorno de tal manera que cada miembro se sienta parte de ese sistema. Este atributo es de interés en el ámbito educativo de distintos niveles, sin embargo, no se cuenta con un instrumento que permita su medición en el medio. El propósito del estudio fue adaptar y analizar la estructura interna de la Escala de Sentido de Pertenencia en universitarios peruanos (ESPU). Se trabajó con una muestra por conveniencia compuesta por 827 universitarios, dividida en dos grupos uno de 220 estudiantes (68.6 % mujeres) con una edad promedio de 21.68 años (DE = 4.87), con la cual se realizó el análisis factorial exploratorio. El segundo grupo estuvo conformado por un total de 607 participantes (69.7 % mujeres) con una edad promedio de 21.28 (DE = 4.21) años, con el cual se realizaron los análisis factoriales confirmatorios. Los resultados dan cuenta de la adaptación lingüística, apreciándose un acuerdo inter-observadores adecuado (RVC > .70). El análisis factorial exploratorio sugiere una estructura de dos factores (χ2 = 646.750; gl = 36.00; p < .001) que explica el 41.2 % de la varianza; esta estructura fue corroborada mediante un análisis factorial confirmatorio que alcanzó índices de ajuste adecuados (CFI = .998; TLI = .996; RMSEA = .048). La fiabilidad de la escala se determinó por consistencia interna encontrándose coeficientes omegas que van entre .665 y .929. En suma, la ESPU es un instrumento con adecuadas evidencias de validez y fiabilidad para medir el sentido de pertenencia.
Palabras clave: sentido de pertenencia; estudiantes universitarios; análisis factorial confirmatorio; validez; educación.
Abstract:
The sense of belonging refers to the experience of participation in a system or environment in such a way that each member feels an integral part of that system. This attribute is of interest in different educational environments of different levels, however, there are no measures that allow its correct measurement. The purpose of the study was to adapt and analyze the internal structure of the Sense of Belonging Scale in Peruvian university students (SBUS). For this, we worked with a convenience sample made up of 827 university students, divided into two groups, one of 220 students (68.6 % women) with an average age equal to 21.68 years (SD = 4.87), with which the exploratory factorial analysis was carried out. The second group consisted of a total of 607 participants (69.7 % women) with an average age of 21.28 (SD = 4.21) years, with which confirmatory factor analyzes were performed. The results show the linguistic adaptation, appreciating an adequate inter-observer agreement (RVC > .70). The exploratory factor analysis suggests a two-factor structure (χ2 = 646.750; df = 36.00; p < .001) that explains 41.2 % of the variance; this structure was corroborated by a confirmatory factor analysis, which reached adequate fit indices (CFI = .998; TLI = .996; RMSEA = .048). The reliability of the scale was determined by internal consistency, finding omega coefficients ranging between .665 and .929. In summary, the SBUS is an instrument with adequate evidence of validity and reliability to measure the sense of belonging.
Keywords: sense of belonging; university students; confirmatory factor analysis; validity; education.
Resumo:
O sentimento de pertencimento refere-se à experiência de participação em um sistema ou ambiente de forma que cada membro se sinta parte integrante desse sistema. Este atributo é de interesse no âmbito educativo em distintos níveis, entretanto, não existem instrumentos que permitam sua mensuração nesse meio. O objetivo do estudo foi adaptar e analisar a estrutura interna da Escala de Sentido de Pertencimento em estudantes universitários peruanos (ESPU). Trabalhou-se com uma amostra de conveniência composta por 827 universitários, divididos em dois grupos, um de 220 estudantes (68,6 % mulheres) com média de idade de 21,68 anos (DP = 4,87), com o qual foi realizado uma análise fatorial exploratória. O segundo grupo foi composto por um total de 607 participantes (69,7 % mulheres), com média de idade de 21,28 anos (DP = 4,21), com o qual foram realizadas análises fatoriais confirmatórias. Os resultados mostram a adaptação linguística, apreciando-se uma adequada concordância interobservadores (RVC > 0,70). A análise fatorial exploratória sugere uma estrutura de dois fatores (χ2 = 646,750; gl = 36,00; p < 0,001) que explica 41,2 % da variância; esta estrutura foi corroborada pela análise fatorial confirmatória, que alcançou índices de ajuste adequados (CFI = 0,998; TLI = 0,996; RMSEA = 0,048). A confiabilidade da escala foi determinada pela consistência interna, sendo encontrados coeficientes ômega entre 0,665 e 0,929. Em suma, a ESPU é um instrumento com evidências adequadas de validade e confiabilidade para medir o sentimento de pertencimento.
Palavras-chave: sentimento de pertencimento; estudantes universitários; análise fatorial confirmatória; validade; educação.
Recibido: 28/06/2023
Aceptado: 23/05/2024
El sentido de pertenencia (SP) hace referencia a la experiencia de participación en un sistema o entorno de tal manera que cada miembro se siente valorado, incluido y aceptado, es decir, parte integral de dicho sistema (Pedler et al., 2022). Es un atributo que favorece la estabilidad, el interés y la proyección a futuro (Mellor et al., 2008). El SP es un atributo que puede desarrollarse en diferentes ámbitos de la vida de las personas, como la familia, escuela, universidad, centro laboral, entre otros (Hagerty et al., 1996). Asimismo, el SP predice cuán significativa se percibe la propia vida (Lambert et al., 2013) y el involucramiento en las actividades o grupos en los que se desarrollan las personas (Haim-Litevsky et al., 2023). Recientemente, Slaton et al. (2023) encontraron que el sentido de pertenencia modera significativamente la relación estudiante-maestro.
En el ámbito educativo, el sentido de pertenencia universitaria (SPU) se define como la percepción afectiva, cognitiva y social con respecto a la universidad en la que se estudia (Dávila de León & Jiménez, 2014). El SPU aglutina el desarrollo de sentimientos o sensaciones de conexión que experimenta el estudiante al sentirse aceptado, respetado, valorado e importante para el grupo y la universidad (Strayhorn, 2018).
Una clasificación estructurada es la de Ahn y Davis (2020); su análisis del sentimiento de pertenencia a la universidad de los estudiantes es multidimensional, definiendo cuatro ámbitos independientes entre sí: el compromiso académico, social, el entorno (ubicación geográfica, espacio natural, los espacios vitales y los aspectos culturales) y el espacio personal (al ámbito de las autoidentificaciones, la autoestima y la satisfacción vital). La pertenencia universitaria varía según las características institucionales y estudiantiles, como lo demuestran los estudios de Gopalan y Brady (2020) quienes destacan que los estudiantes de minorías raciales y étnicas y de primera generación (primer año) reportan una pertenencia más baja que sus compañeros con cuatro años. También el estudio de Vaccaro & Newman (2017) analiza la generación del sentido de pertenencia estudiantes LGBTQ de primer año. Por otra parte, Walton y Cohen (2007) encontraron que la pertenencia social en la universidad aumenta el rendimiento académico de los grupos étnicos menos representados.
Las diferentes investigaciones sobre los aportes del SPU sugieren que los estudiantes que tienen un mayor sentido de pertenencia tienden a desarrollar una mayor motivación y persistencia (Strayhorn, 2012; Yeager et al., 2016), más autoconfianza académica (Hausmann et al., 2007), niveles más altos de compromiso académico (Davila & Jimenez, 2014; Gillen-O’Neel, 2021; Ostrove & Long, 2007), mayor rendimiento (Aramendiz & Delgadillo, 2021; De Besa-Gutiérrez et al., 2019; Pedler et al., 2022; Strayhorn, 2018; Walton & Cohen, 2007) y permite la identificación de estudiantes involucrados con las actividades propuestas por la institución, siendo ellos quienes desarrollan una mejor valoración relativa de la institución (Roque & Quizhpi, 2022).
En línea con ello, Patel et al. (2023) señalan que el sentido de pertenencia es esencial para la motivación humana, incluso puede influir en cómo se desarrollan profesionalmente las personas. De acuerdo con Dávila de León y Jiménez (2014) el SPU constituye un predictor del bienestar general. Así, el SPU se prolonga, por ejemplo, en el caso de egresados; se ha encontrado que mantienen actitudes filantrópicas hacia su alma mater, asociado también al compromiso y participación en voluntariados (Drezner & Pizmony-Levy, 2021).
Por su parte, Xu et al. (2023) refieren que los universitarios con alto sentido de pertenencia muestran una mayor influencia de la identidad profesional y la motivación intrínseca en la mejora de la capacidad de su aprendizaje autorregulado. Sin embargo, Gravett y Ajjawi (2022) califican estos enfoques del SPU como tradicionales, al considerarla como una experiencia universalmente positiva, uniforme, y como un estado fijo del ser. Para ello contextualizan las consecuencias de la pandemia de COVID-19, en donde la crisis puso de manifiesto la fluidez, la desubicuidad y el cambio de las instituciones, llevando a una concepción más matizada de dónde y cuándo pertenecen los estudiantes. Otra aportación reflexiva es la de Graham y Moir (2022), al manifestar la necesidad de una pertinencia auténtica; esto nace de su preocupación por la prevalencia de las pedagogías de pertenencia como una experiencia centrada más en el “encajar en el sistema” que en centrarse en una universidad en construcción emergente que surge y existe a través de las interrelaciones de aquellos involucrados, es decir, cómo el profesorado y estudiantado van constituyendo ecosistemas y comunidades.
Lo expuesto pone en relevancia el estudio del sentido de pertenencia en el contexto universitario, ya que aparentemente constituye un predictor no solo de la performance académica sino también del ajuste en la universidad y por tanto un factor protector ante la deserción académica (Ostrove & Long, 2007). Sin embargo, el estudio de este constructo ha sido poco explorado en Perú. Esto se debe a la ausencia de un instrumento válido y fiable que permita su medición. La revisión de la literatura muestra la escasez de instrumentos que midan el SPU, la mayoría de ellos se aplican a escolares (Kuang et al., 2019; Slaten et al., 2018) y a otros contextos propios del desarrollo profesional (Patel et al., 2023; Rojas-Andrade et al., 2019).
Entre las medidas que se encontraron se tiene a Hagerty et al. (1996) quien diseñó y validó el instrumento Sense of Belonging (SOBI) en tres muestras, una de estudiantes universitarios, otra de pacientes en tratamiento por depresión mayor y otra de religiosas católicas. Inicialmente se verificó la validez basada en el contenido, la cual alcanzó un CVI igual a .83; para determinar la validez estructural de la medida se empleó un análisis factorial exploratorio (AFE) con el método de componentes principales. A pesar de su utilidad, esta no es una medida que permita identificar la pertenencia hacia una institución, sino que más bien explora el estado psicológico del sentido de pertenencia general y el deseo o habilidad de desarrollar este atributo.
En Latinoamérica, se encontró una escala para la medición del sentido de comunidad en grupos virtuales de redes sociales (Novo et al., 2016), desarrollada originalmente en España, cuya validez estructural fue reportada mediante un AFE por componentes principales, procedimiento actualmente desaconsejado (Lloret-Segura et al., 2014). En Chile, Rojas-Andrade et al. (2019) adaptaron la Escala de Sentido de Comunidad (SCI-II) originalmente desarrollada por Chavis et al. (2008) en una muestra de escolares de educación media; los hallazgos permitieron corroborar la estructura de tres dimensiones del constructo (conectividad, pertenencia valorada y membresía-reciprocidad); sin embargo, el sentido de comunidad no es equivalente al sentido de pertenencia.
Recientemente se han propuesto otros instrumentos para medir el sentido de pertenencia. Así, Slaten et al. (2018) crearon el University Belonging Questionnaire sobre una muestra de universitarios estadounidenses. La medida está compuesta por 24 ítems que se distribuyen en tres factores: afiliación a la universidad, apoyo y aceptación de la universidad, relaciones con el profesorado y el personal. No obstante, los índices de ajuste del modelo de tres factores fueron apenas aceptables (CFI = .92; TLI = .93; RMSEA = .05), a pesar de aplicar un estimador de máxima verosimilitud robusta.
Por su parte, Checa y Oberts (2021) adaptaron la Escala General de Pertenencia (EGP) de Malone et al. (2012) a una muestra de adultos españoles de edades entre los 17 y 73 años, si bien los resultados demuestran la solvencia estructural (ECV = .825; CR = .914) y la consistencia de sus puntuaciones (α = .917) se trata de un instrumento que no mide el sentido de pertenencia universitaria y más bien está enfocada en analizar el grado en que las personas han satisfecho su necesidad de pertenencia y han alcanzado un sentido de pertenencia general. Por su parte, Pastor et al. (2022) adaptaron al español la Escala de Necesidad de Pertenencia (EPN) de Leary et al. (2013) sobre una muestra de 540 adultos. Los resultados mostraron que la ENP alcanzó índices de ajuste aceptables, pero los modelos probados mostraron problemas en las cargas factoriales debido a la presencia de ítems redactados de forma inversa; dicha estructura mejoró al excluir estos ítems (CFI = .98; NNFI = .97; AIC = 59.27). Es necesario recalcar que este instrumento no mide el sentido de pertenencia universitario, lo que en realidad mide es la necesidad de pertenecer como una forma de motivación que impulsa la construcción de vínculos interpersonal.
Existen otros instrumentos como la Escala de Identificación Organizacional con los Centros Educativos y la Escala de Identificación Organizacional con Centros de Estudios; la primera fue validada por Maluenda-Albornoz et al. (2022a) y la segunda por Yáñez et al. (2006). Si bien ambas miden la identificación, la primera adopta una conceptualización de la pertenencia como una persona que forma parte de una organización y el segundo instrumento lo que mide es la identificación del estudiante con su carrera de estudio, no con la institución.
Así, los instrumentos descritos miden algún aspecto especifico de la identificación con la carrera, o con la organización desde una perspectiva de un miembro del equipo laboral de dicha institución; sin embargo, es necesario conocer el sentido de pertenencia como experiencia psicológica en términos de participación valorada y ajuste persona-entorno de los universitarios y como ella puede propiciar el bienestar e incluso reducir los niveles de deserción académica (Maluenda-Albornoz et al., 2023)
Por otra parte, Akar-Vural et al. (2013) diseñaron la Sense of Belonging Scale, inicialmente dirigida hacia adolescentes turcos, que mide el sentido de pertenencia hacia la escuela. Su modelo teórico subyacente comprende dos dimensiones: la primera denominada Contenment in school, la cual hace referencia al orgullo y felicidad de ser parte de la institución, y la segunda denominada Obedience of school rules, que aborda el cumplimiento de las normas establecidas por la institución. Los resultados del análisis factorial confirmatorio (AFC) permitieron corroborar esta estructura bifactorial, encontrándose índices de ajuste satisfactorios (CFI = .98; NNFI = .97; RMSEA = .059).
La búsqueda de instrumentos para medir el SPU llevó al equipo de investigación a elegir a la Sense of Belonging Scale (Akar-Vural et al., 2013) como una medida que cuenta con respaldo teórico, ya que desde la conceptualización del constructo se toma en cuenta su naturaleza multidimensional y la experiencia psicológica como tal, pues considera la identificación, seguridad y apoyo emocional percibido (Dávila de León & Jiménez, 2014), que para desarrollarse requiere de tiempo; incluso es posible que la edad modere su afianzamiento (Hagerty et al., 1996).
El propósito principal de la presente investigación fue adaptar y analizar las evidencias de validez y fiabilidad de la Sense of Belonging Scale en una muestra de universitarios peruanos. Específicamente se realizó la adaptación al español de la escala mediante el procedimiento de acuerdo interobservadores (back translation). Luego, se exploró la validez de estructura interna. Adicionalmente, se constató la invarianza factorial según la edad y finalmente se reportó la consistencia interna de las puntuaciones.
Método
Participantes
El presente es un estudio de diseño instrumental (Ato et al., 2013) en el que participaron 827 estudiantes de una universidad privada de Perú, todos elegidos por conveniencia, debido a su accesibilidad. Para los fines del estudio esta muestra se dividió en dos; con el primer grupo se realizaron los análisis exploratorios de la estructura interna. Esta muestra estuvo compuesta por 220 estudiantes, 68.6 % mujeres con una edad promedio igual a 21.68 años (DE = 4.87). El segundo grupo estuvo conformado por un total de 607 participantes entre varones (30.3 %) y mujeres (69.7 %) con una edad promedio de 21.28 años (DE = 4.21). El 49.1 % tienen una edad igual o menor a 20 años y 50.9 % tienen una edad mayor o igual a 20 años, procedentes de las carreras de psicología (30.70 %), administración (26.5 %), educación (25.5 %), ingeniería (10.5 %) y comunicaciones (6.8 %) de una sede ubicada en Lima Metropolitana. Todos corresponden al nivel socioeconómico C, que corresponde a clase media, y comparten características socioculturales comunes.
Instrumentos
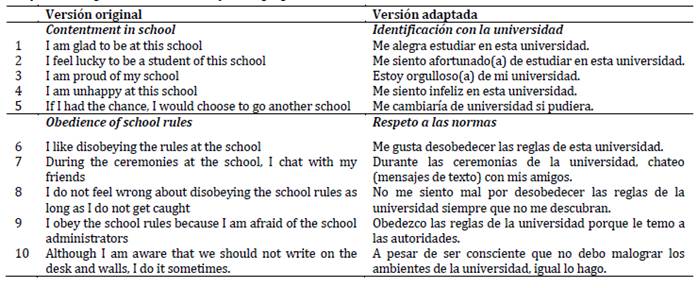
Escala de Sentido de Pertenencia (ESP; Akar-Vural et al., 2013). Es un autoinforme compuesto por 10 ítems que miden el sentido de pertenencia a la escuela en dos dimensiones: Identificación con la escuela (ítems, 1, 2, 3, 4 y 5) Respeto a las normas (ítems, 6, 7, 8, 9 y 10), que aborda la desobediencia de las normas de la institución. Los ítems de la ESP presentan un escalamiento de respuesta tipo Likert de cinco opciones de respuesta que van de 1: fuertemente en desacuerdo a 5: fuertemente de acuerdo. Las propiedades psicométricas de la medida fueron analizadas mediante un AFE con el método de componentes principales y rotación varimax, se verificaron los supuestos de adecuación muestral (KMO = .86) y de intercorrelación de los ítems (χ2 = 1526.71; gl = 45; p < .001). La estructura de dos factores explicó el 60.72 % de la varianza y las cargas factoriales oscilan entre .68 y .86. Posteriormente, a través de un AFC con el método de máxima verosimilitud se corroboró la estructura bifactorial, Factor 1: Contentment in school y Factor 2: Obedience of school rules, los cuales obtuvieron adecuados índices de ajuste (χ2 = .80.93; p < .001; CFI = .98; NNFI = .97; RMSEA = 0.059). También se constató la validez en relación con otras variables, identificándose correlaciones positivas significativas con los puntajes de la Escala de Soporte Social Percibido y correlaciones negativas y significativas con los puntajes de la Escala de Soledad de UCLA; en cuanto a la fiabilidad se reportaron coeficientes alfa por encima de .70, lo que corresponde a valores adecuados.
Para la presente investigación se adaptaron los reactivos del inglés al castellano; además, se modificó la realidad discursiva de los reactivos a un contexto universitario; para esto, se siguieron las indicaciones de la International Test Commission (ITC, 2017) y se contó con la asesoría de dos traductores con experiencia en estos procedimientos, a quienes se les encomendó el proceso de traducción de los reactivos (back translation).
Tabla 1: Adaptación lingüística de la Sense of Belonging Scale
Procedimientos
La recopilación de datos fue ejecutada en el último semestre de 2021 y primeros meses del 2022, de manera virtual a través de un formulario Google Forms sobre una muestra de universitarios, la cual fue contactada por distintos medios: correo personal e institucional. Este formulario contempla un consentimiento informado en donde se explica el objetivo del estudio, la naturaleza voluntaria de la participación y se garantiza el anonimato de los participantes. Para mitigar los riesgos de la aplicación remota de la prueba, se siguieron las recomendaciones de Elosua (2021): se aseguró la información recabada, se generó una copia de seguridad de la información, se brindaron indicaciones para que la respuesta de los formularios se hiciera en condiciones de privacidad. El equipo de investigación aseguró que las condiciones de evaluación facilitaran las respuestas de los participantes; durante todo el proceso de la investigación se garantizó la confidencialidad y anonimato de los participantes (American Educational Research Association et al., 2018).
Análisis de datos
El análisis estadístico se realizó con el paquete IBM SPSS versión 25 el cual se utilizó para realizar el análisis descriptivo de los ítems y el AFE y con el RStudio versión 1.1.456, específicamente con la librería lavaan (Rosseel, 2012) para realizar el AFC. El análisis estadístico se realizó mediante etapas. Se verificó la ausencia de outliers y datos faltantes, el supuesto de normalidad se revisó mediante los coeficientes de asimetría (g1) y curtosis (g2) se tomó como rango para estimar una distribución normal valores ± 1.5 (Medrano & Muñoz-Navarro, 2017; Pérez & Medrano, 2010).
Para la verificación del índice de acuerdo interobservadores se utilizó el Content Vality Ratio (CVR) propuesto por Lawshe (1975) y posteriormente modificado por Tristan (2008). Su elección respondió a las necesidades de verificación en un alcance de alternativas dicotómicas (acuerdo/desacuerdo) por parte de los observadores respecto de la equivalencia de las traducciones realizadas; valores por encima de .50 sugieren un acuerdo aceptable.
Se realizó un AFE se constató la adecuación muestral y la intercorrelacion de los ítems, se empleó el método de Weighted Least Squares (WLS) con rotación promax. Luego, se realizó un AFC con el método de Weighted Least Square Mean and Variance Adjusted (WLSMV); por la naturaleza categórica de los datos (Verdam et al., 2016) se consideraron adecuadas cargas factoriales de .40 (Williams et al., 2010). Se aplicó un ajuste al estadístico χ2 para atenuar el efecto de la falta de normalidad (Satorra & Bentler, 1994; SB χ2)
Los índices de ajuste revisados fueron la razón chi-cuadrado entre los grados de libertad (χ2/gl) con valores esperados menores a 3, Root Mean Square Error of Approximation (RMSEA) y Standarized Root Mean Square Residual (SRMR); en ambos casos se esperaron valores por debajo a .08 sugeridos por Bentler y Bonnet (1980). Se incluyeron el Comparative Fit Index (CFI) e Índice de Tucker-Lewis (TLI) cuyos valores aceptables se encuentran por encima de .95 (Hu & Bentler, 1999). A partir de las cargas factoriales de ambos modelos, se calculó la varianza promedio extraída (Average Variance Extracted (AVE)) siendo satisfactorios valores alrededor de .50; con ello se verificaron las evidencias de validez interna convergente (Fornell & Larcker, 1981). Adicionalmente, se reportó el Compositive Reliability (Coeficiente de Fiabilidad Compuesta (FC)) siendo aceptables valores superiores a .70. También, se verificó la invarianza configuracional, métrica, fuerte y estricta para la cual se consideraron cambios ΔCFI ≤ 0,01, ΔRMSEA ≤ 0,015 para establecer la invarianza (Byrne, 2008; Putnick & Bornstein, 2016).
Finalmente, para constatar la fiabilidad de la Escala de Sentido de Pertenencia Universitaria (ESPU) se utilizó el método de consistencia interna, se calculó el coeficiente omega, debido a la naturaleza ordinal de las variables (Katz, 2006; Ventura-León, 2017).
Resultados
Traducción y adaptación lingüística
Para verificar la pertinencia de la traducción (inglés-español) se solicitó a tres traductores con experiencia en este tipo de procedimientos, a quienes se les preguntó si estaban de acuerdo (1) o en desacuerdo (0) con la calidad de la traducción realizada, el acuerdo de las respuestas se verificó mediante el coeficiente CVR reportándose valores que oscilan entre .667 y 1.000 (ver Tabla 2).
Este procedimiento se replicó para evaluar la traducción del español al inglés (back translation) los índices de acuerdo presentaron un comportamiento similar (CVR > .66). Adicionalmente, se solicitó a tres expertos en educación superior y psicología educativa, quienes observaron la pertinencia del lenguaje utilizado para cada ítem adaptado. Así, se decidió cambiar la palabra “escuela” por “universidad”, sobre estos cambios se alcanzó un acuerdo del 100 % en todos los reactivos.
En la Tabla 2 se exponen los índices de acuerdo para la traducción del inglés al español, el back translation y la adaptación lingüística de la ESPU. Adicionalmente, se consultó a una muestra de 20 estudiantes sobre la comprensión de las preguntas y la correspondencia con las alternativas de respuesta, en general las respuestas fueron favorables.
Tabla 2: Índices de acuerdo para la adaptación lingüística
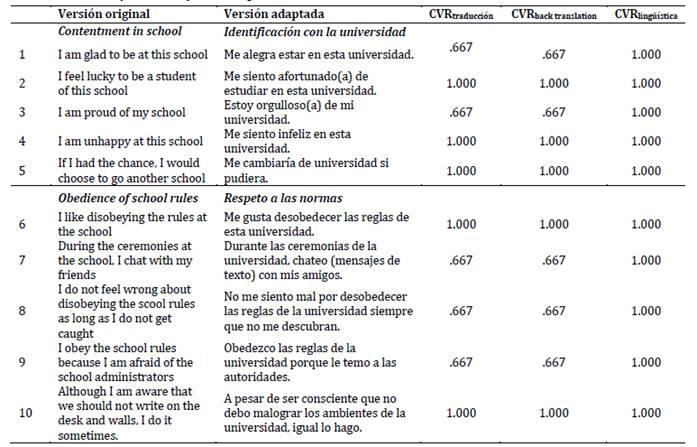
Nota: Índice de acuerdo Lawshe (1975) modificado por Tristan (2008), valores adecuados a partir de 0.51.
Estadísticos descriptivos y distribucionales
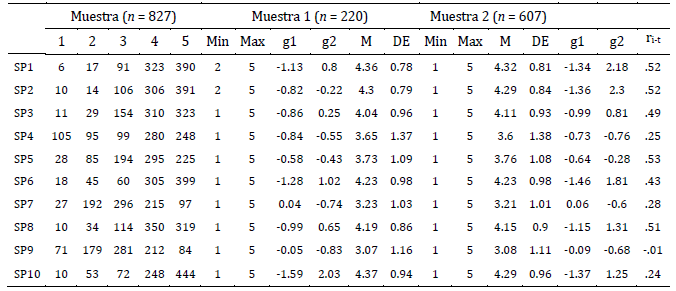
En la Tabla 3 se exponen los estadísticos descriptivos de la ESP para ambas muestras. Para la muestra 1, el promedio oscila entre 3.07 y 4.36 con una variabilidad que fluctúa entre 0.78 y 1.37. En relación con la muestra 2, los promedios de las puntuaciones van entre 3.081 y 4.316; los coeficientes de asimetría sugieren una asimetría negativa en la mayoría de los reactivos; por su parte, los coeficientes de curtosis denotan que la mayor proporción presentan una distribución platicurtica, con excepción de los ítems 4, 2, 7 y 9 los cuales presentan una distribución leptocúrtica. También se reportan las frecuencias de las alternativas de respuesta, el cual es considerado un estadístico que permite interpretar un conjunto de variables de naturaleza ordinal. Estos valores muestran que existe una distribución más acentuada hacia las alternativas 4 y 5. Las correlaciones ítem-test corregido se calcularon para la muestra de 607 participantes, estas muestran que la mayoría de los reactivos están por encima de .20 con excepción del ítem 9.
Tabla 3: Estadísticos descriptivos de la Escala de Sentido de Pertenencia
Evidencias de validez basada en la estructura interna
El AFE se realizó sobre una muestra de 220 participantes, el índice de adecuación muestral resulto aceptable .789; asimismo, la intercorrelación de los reactivos resultó adecuada (χ2 = 646.750; gl = 36.00; p < .001). Las cargas factoriales encontradas en el primer factor (27.9 %) van de .659 a .870, resulta que el ítem 4 no satura adecuadamente; en cuanto al segundo factor (13.3 %), las cargas fluctúan entre .256 y .622. Este modelo exploratorio explicó el 41.2 % de la varianza (ver Tabla 4).
Tabla 4: Análisis factorial exploratorio para la Escala de Sentido de Pertenencia
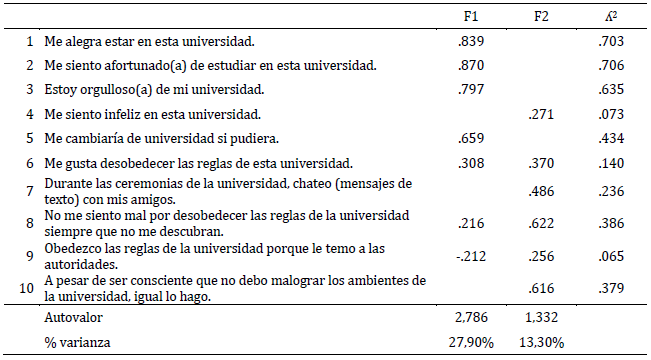
Nota: Método de extracción Weighted Least Squares (WLS) con rotación promax.
Análisis factorial confirmatorio
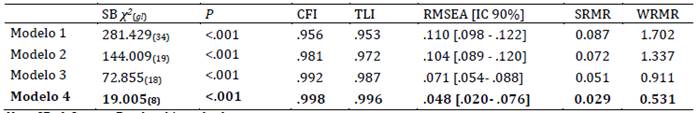
A partir de la información obtenida en el AFE se analizaron cuatro modelos confirmatorios (ver Tabla 5). En el Modelo 1 bidimensional, se encontraron cargas factoriales por encima de .40, con excepción de los ítems 4 y 9, con índices de ajuste parcialmente adecuados (SB χ2/34 = 8.27; CFI > .95). En el Modelo 2 se excluyen los ítems 4 y 9, con ello las cargas factoriales aumentan, pero los índices de ajuste no mejoran sustancialmente (SB χ2/19 = 7.57; CFI > .95); adicionalmente, se ha incluido la carga factorial al cuadrado (ʎ2) con la intención de exponer una medida más precisa de la asociación del ítem con su respectivo factor, se puede apreciar en que los ítems 4, 5, 9 y 10 presentan valores por debajo de .40, lo que indica que la varianza especifica de estos ítems es demasiado alta.
Tabla 5: Modelos confirmatorios de la Escala de Sentido de Pertenencia
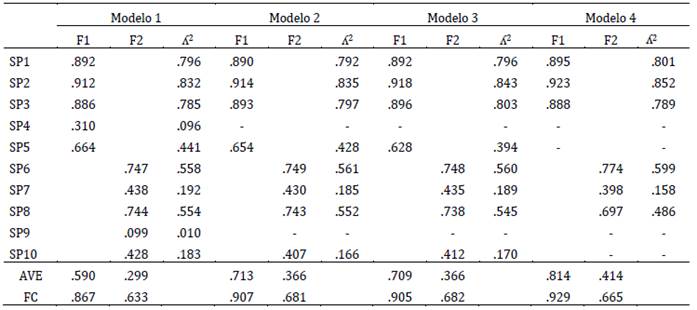
Notas: Modelo 1: Modelo bidimensional original; Modelo 2: Modelo bidimensional sin ítems 4 y 9; Modelo 3: Modelo bidimensional sin ítems 4, 9 y con un error correlacionado entre ítems 5 y F2; Modelo 4: Modelo bidimensional sin ítems 4, 5, 9 y 10.
Luego de revisar los índices de modificación se propone el Modelo 3, modelo bidimensional sin los ítems 4, 9 y con un error correlacionado entre el ítem 5 y el segundo factor, las cargas factoriales mejoran y los índices de ajuste resultan parcialmente satisfactorios (SB χ2/18= 4.04; CFI > .99); sin embargo, que el ítem 5 correlacione con el segundo factor es teóricamente inadecuado. Por ello, en el Modelo 4, modelo bidimensional sin los ítems 4, 5, 9 y 10, los índices de ajuste resultan muy satisfactorios (SB χ2/8 = 2.37; CFI > .99).
Asimismo, se calculó el AVE para evaluar la fiabilidad convergente de los factores identificados identificándose que los valores AVE del factor 2, que corresponde a obediencia de las normas es el que presenta valores por debajo de lo esperado (< .50); sin embargo, en el modelo 4, es en el que se encuentra el valor más alto de este coeficiente. Esto es similar a lo que ocurre con los valores del coeficiente de Fiabilidad Compuesta (FC), en el Modelo 1 para el primer factor fue igual a .867, para el segundo factor se encontró un coeficiente igual a .633, lo que demuestra que la medida presenta una adecuada consistencia en sus puntuaciones. Para los modelos restantes este comportamiento se mantuvo, arrojando medidas mayores para el primer factor. Así, en el Modelo 4, el primer factor alcanzó un FC = .929 y para el segundo factor fue de .665.
En la Tabla 6, se exponen los índices de ajuste para los modelos analizados, se observa que los índices comparativos sugieren que el Modelo 4 presenta la estructura más parsimoniosa y coherente, ello en consideración que el Modelo 3, pues se sugiere el desplazamiento de un ítem que teóricamente fue concebido para un factor diferente.
Tabla 6: Índices de ajuste del modelo de medida
Nota: SB χ2 = Satorra-Bentler chi-cuadrado.
Invarianza factorial, según edad y sexo
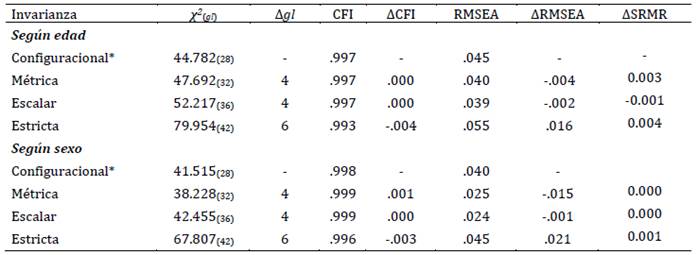
En la Tabla 7, una vez identificado que el Modelo 4 es el que presenta una mejor estructura interna, se analizó la invarianza factorial por edad y sexo. Al respecto, los resultados permiten concluir que la ESPU presenta invarianza configuracional, métrica, escalar y estricta. Al corroborarse la invarianza configuracional esto indica que los mismos ítems o factores están presentes en todas las muestras, aunque los valores específicos de los parámetros pueden variar. En lo que refiere a la invarianza métrica, los resultados demuestran que, la fuerza de las relaciones entre los ítems o factores y el constructo es constante en ambas muestras. Respecto a la invarianza escalar, se refiere a la igualdad de la varianza de los errores de medición de los ítems o factores en todos los grupos o condiciones. En cuanto a la invarianza estricta, los resultados indican que los ítems o factores miden el mismo constructo en todos los grupos, y que las cargas de los ítems o factores son iguales en todos los grupos. En suma, la invarianza en estos cuatro niveles sugiere que el instrumento de medición es válido y confiable para su uso en diferentes grupos o condiciones, ya que mide consistentemente el mismo constructo de manera similar en todos ellos.
Tabla 7: Invarianza factorial de la ESPU según grupo de edad y sexo
Evidencias de fiabilidad
La confiabilidad de la ESPU se estimó para los modelos 1, 2 y 4. Para el primer modelo, el factor 1, obtuvo un coeficiente omega igual a .809; mientras que el factor 2, alcanzó un coeficiente igual a .576. En el segundo modelo, se obtuvieron coeficientes omegas igual a .864 y .593 para los factores 1 y 2 respectivamente. En el modelo 4, los valores de fiabilidad fueron de .883 (primer factor) y .571 (segundo factor). Tal como se puede apreciar los valores de fiabilidad del primer factor resultan adecuadas en todos los modelos probados; sin embargo, el segundo factor apenas obtiene medidas por encima de .50, esto sugiere que sus puntajes no son consistentes.
Discusión
El sentido de pertenencia en universitarios hace referencia a la identificación con la institución en la que se estudia, atributo que resulta importante para un adecuado desempeño académico (Hagerty et al., 1996). Su estudio es relevante ya que favorece el potencial de los estudiantes (Aramendiz & Delgadillo, 2021; De Besa-Gutierrez et al., 2019; Hausmann et al., 2009), se relaciona con la adecuación a la vida universitaria (Ostrove & Long, 2007) y con el bienestar general (Dávila de León & Jiménez, 2014).
El propósito del presente estudio fue adaptar lingüísticamente y analizar la estructura interna de la Sense of Belonging Scale (Akar-Vural et al., 2013) sobre una muestra de universitarios. Los resultados dan cuenta que el procedimiento de traducción realizado acorde con las indicaciones de la ITC (2017), y la adecuación lingüística realizada donde se reemplazó la palabra “escuela” por “universidad” no alteró el contenido de la medida, y favoreció a la comprensión de los reactivos en el contexto universitario peruano. El procedimiento permitió verificar la adecuación semántica de cada reactivo y se obtuvieron buenos índices de acuerdo (Muñiz et al., 2013).
En lo referente a la validez estructural de la ESPU se determinó que de los cuatro modelos analizados el Modelo 4 resultó ser el más pertinente. Para su análisis se eliminaron los reactivos que presentaron comportamientos inestables, entre ellos el ítem 4 “Me siento infeliz en esta universidad”, ítem 5 “Me cambiaría de universidad si pudiera”, ítem 9 “Obedezco las reglas de la universidad porque le temo a las autoridades” e ítem 10 “A pesar de ser consciente que no debo malograr los ambientes de la universidad, igual lo hago”, mejorando la eficiencia de la medida y resultando en una estructura parsimoniosa, coherente e interpretable (Fornell & Larcker, 1981).
La eliminación de estos cuatro ítems puede alterar el contenido teórico de la ESPU; sin embargo, esta decisión se tomó luego de considerar que la forma en la que estaban redactados los ítems generaba confusión. Esta decisión puede respaldarse en documentos en donde se ha escrito sobre el efecto de los ítems redactados negativamente y las sugerencias actuales son no incluirlos en medidas de tipo Likert (Suárez-Álvarez et al., 2018; Tomás et al., 2012). Además, la cantidad de tres ítems por factor puede justificarse a partir de lo indicado por autores como Frías-Navarro (2022) y Costello y Osborne (2005) quienes señalan que la inclusión de tres ítems por factor constituye un tamaño suficiente para una adecuada medición de un atributo, incluso para el cálculo de su fiabilidad.
Es posible que estas diferencias encontradas en cuanto a la estructura interna y la eliminación de ítems respecto con la versión original desarrollada por Akar-Vural et al. (2013), se deba principalmente a cuestiones culturales, específicamente a la capacidad de comprensión de textos por parte de los participantes, esto se ha visto reflejado en las cargas factoriales bajas obtenidas por los ítems redactados negativamente. Como se ha podido ver reflejado en los ítems 4 “Me siento infeliz en esta universidad” y 5 “Me cambiaría de universidad si pudiera”.
Otra razón que puede tener implicancias sobre los resultados es la valoración que puede hacerse sobre la obediencia de las reglas dimensión del sentido de pertenencia universitaria, esto a razón que la fiabilidad de esta dimensión está muy debajo de lo esperado. En general, los países latinoamericanos tienen una expectativa negativa sobre sus autoridades lo que los lleva a cuestionarlos constantemente, es posible que los universitarios encuestados tengan arraigado dicho patrón lo que ha evidenciado como esta dimensión ha obtenido resultados inconsistentes que se haya visto reflejado en un esfuerzo insuficiente de respuesta (careless) (Johnson, 2005). Esta perspectiva sobre las autoridades es diferente en Europa, lo que puede generar menos sesgos o deseabilidad social en sus respuestas.
A partir de los análisis estadísticos realizados se obtuvo una versión corta de la ESPU (Modelo 4) conservándose la estructura teórica subyacente sobre la cual fue desarrollada y obtiene incluso mejores índices de ajuste que la versión original (Akar-Vural et al., 2013). Así, se mantiene el primer factor denominado identificación con la institución y la segunda obediencia de las normas. Con ello se corrobora la naturaleza multidimensional del constructo, la cual ha sido expuesta en otras medidas (Hagerty et al., 1996; Chavis et al., 2008; Rojas-Andrade et al., 2019; Slaten et al., 2018). Sin embargo, es preciso señalar que, si bien inicialmente la ESPU puede utilizarse para medir el sentido de pertenencia universitario, esto no implica que esta contenga todos componentes necesarios para un abordaje profundo del sentido de pertenencia pues, como se ha descrito, la pertenencia se da por el sentido de conexión con la institución (identificación), el sentirse valorado y respetado, y también por sentirse de algún modo responsable con la institución.
Asimismo, se pudo establecer la invarianza factorial de la medida según edad y sexo (Modelo 4), lo que indica que la ESPU no introduce sesgos en la medición de este atributo en universitarios peruanos (Byrne, 2008). Al corroborarse la invarianza configuracional, métrica, escalar y estricta, esto implica que la estructura interna es solvente, que los ítems miden el factor en el cual están relacionados y que la fuerza de las relaciones entre los ítems o factores y el constructo es constante tanto por edad como por sexo (Putnick & Bornstein, 2016). En suma, la invarianza en estos cuatro niveles sugiere que el instrumento de medición es válido y confiable para su uso en diferentes grupos o condiciones, ya que mide consistentemente el mismo constructo de manera similar en todos ellos (Svetina et al., 2020).
En cuanto a la fiabilidad esta se calculó mediante el coeficiente omega, ya que resulta ser una medida más eficiente para variables ordinales. Los hallazgos permiten afirmar que la ESPU es consistente en sus puntuaciones para el primer factor y presenta valores apenas inadecuados para el segundo factor. Estos hallazgos fueron relativamente superiores a los reportados en el estudio de Akar-Vural et al. (2013). No obstante, es necesario considerar la interpretación de un coeficiente adicional, el cual se desprende de las cargas factoriales, el coeficiente de fiabilidad compuesta, que obtiene valores adecuados en todos los factores de los modelos probados. Esta discrepancia en el cálculo de los coeficientes podría dar lugar a nuevas investigaciones en donde se busque establecer la razón de estas discrepancias ya que, si solo se consideran los valores omegas, estos están por debajo de .667 para el segundo factor de obediencia de normas (Krippendorff, 2011). Esta discrepancia se puede deber a problemas en la comprensión de los enunciados o el esfuerzo insuficiente de respuesta por la naturaleza del constructo.
Las implicancias prácticas de la presente investigación tienen que ver con la contribución de una medida que permitirá el estudio del sentido de pertenencia en el ámbito universitario, toda vez que es un constructo que se relaciona con el ajuste a la vida universitaria (Ostrove & Long, 2007), rendimiento académico (Aramendiz & Delgadillo, 2021), fortalecimiento de la formación profesional (Corona, 2020), permite la identificación de estudiantes involucrados con las actividades propuestas por la universidad, quienes desarrollan una actitud más favorable hacia la institución (Roque & Quizhpi, 2022), y orienta el sentido de vida de las personas (Lambert et al., 2013). Sin embargo, es necesario profundizar en el estudio de la fiabilidad del instrumento para identificar si los valores bajos de fiabilidad se deben a un factor de método asociado a la redacción de ítems negativos, los cuales son predominantes en el segundo factor. Asimismo, es necesario tomar esta medición con cautela y tener en consideración que este es un primer estudio y que se requieren más análisis para obtener una medida que tenga una mayor consistencia interna.
En resumen, se obtiene una versión breve de la ESPU compuesta por seis ítems que se distribuyen en dos factores: identificación con la universidad (“Me alegra estudiar en esta universidad”, “Me siento afortunado de estudiar en esta universidad”, “Estoy orgulloso de mi universidad”) y respeto a las normas (“Me gusta desobedecer las reglas de esta universidad”, “Durante las ceremonias de la universidad, chateo (mensajes de texto) con mis amigos. No me siento mal por desobedecer las reglas de la universidad siempre que no me descubran”). En este sentido, el análisis del contenido de los ítems y sus dimensiones es consistente con la conceptualización del sentido de pertenencia que se ha expuesto en el presente trabajo, pues este se entiende como la experiencia psicológica en términos de participación valorada y ajuste persona-entorno de los universitarios (Maluenda-Albornoz et al., 2022b, Maluenda-Albornoz et al., 2023).
Asimismo, el ESPU hace alusión a una percepción afectiva, cognitiva y social con respecto a la universidad en la que se estudia (Dávila de León & Jiménez, 2014). Es por ello que los ítems que componen la escala aglutinan en su contenido sentimientos o sensaciones de conexión, que se ven reflejados en el primer factor. Mientras tanto, las experiencias de aceptación parten desde la aceptación de las normas de convivencia, los cuales se manifiestan al sentirse aceptado, respetado, valorado e importante para el grupo y la universidad (Strayhorn, 2018), elementos que se exponen en el segundo factor de la ESPU, aunque la inclusión de ítems redactados de forma negativa que exploran el respeto de normas ha podido tener un efecto contraproducente derivado en los resultados que se han discutido. Se hace necesario continuar con el estudio del instrumento y de aspectos como la equivalencia conceptual y la revisión del contenido de los reactivos en posteriores estudios.
La principal limitación del estudio reside en la naturaleza no probabilística de la muestra seleccionada, lo cual hace que los resultados deban tomarse considerando la limitada capacidad de generalización, siendo interpretables solo para contextos socioculturales similares. Otra limitación del estudio tiene que ver con que no se exploraron otras evidencias de validez como la relación con otros constructos, lo que hace necesario que se encaminen próximas investigaciones en las que se complementen estos hallazgos.
Referencias:
Ahn, M. Y., & Davis, H. H. (2020). Four domains of students’ sense of belonging to university. Studies in Higher Education, 45(3), 622-634. https://doi.org/10.1080/03075079.2018.1564902
Akar-Vural, R., Yılmaz-Özelçi, S., Çengel, M., & Gömleksiz, M. (2013). The development of the “Sense of Belonging to School” Scale. Egitim Arastirmalari Eurasian. Journal of Educational Research, 53, 215-230. https://doi.org/10.14689/EJER.2013.53.12
American Educational Research Association, American Psychological Association, & National Council on Measurement in Education. (2018). Standards for Educational and Psychological Testing. American Educational Research Association.
Aramendiz, M. F., & Delgadillo, N. (2021). Factores Asociados al Sentido de Pertenencia y su Relación con el Rendimiento Académico de los Estudiantes del Programa de Psicología de la Universidad Nacional Abierta y a Distancia-UNAD, CEAD Ibagué. (Tesis de Grado, Universidad Nacional Abierta y a Distancia). Repositorio Institucional UNAD. https://repository.unad.edu.co/handle/10596/40219
Ato, M., López-García, J. J., & Benavente, A. (2013). Un sistema de clasificación de los diseños de investigación en psicología. Anales de Psicología, 29(3), 1038–1059. https://doi.org/10.6018/analesps.29.3.178511
Bentler, P., & Bonett, D. (1980). Significance tests and goodness of fit in the analysis of covariance structures. Psychological Bulletin, 88(3), 588-606. https://doi.org/10.1037//0033-2909.88.3.588
Byrne, B. (2008). Testing for multigroup equivalence of a measuring instrument: A walk through the process. Psicothema, 20(4), 872-882.
Chavis, D., Lee, K., & Acosta J. (2008, junio). The Sense of Community (SCI) Revised: the reliability and validity of the SCI-II (Presentación de artículo). 2nd International Community Psychology Conference, Lisboa, Portugal.
Checa, I., & Oberst, U. (2022). Measuring belongingness: Validation and invariance of the general belongingness scale in Spanish adults. Current Psychology, 41(1), 8490-8498. https://doi.org/10.1007/s12144-020-01279-x
Corona, A. (2020). El sentido de pertenencia, una estrategia de mejora en el proceso formativo en las artes. Estudio de caso en Danza en una universidad mexicana. Páginas de Educación, 13(2), 59-79. https://doi.org/10.22235/pe.v13i2.2172
Costello, A. B., & Osborne, J. (2005). Best practices in exploratory factor analysis: four recommendations for getting the most from your analysis. Practical Assessment Research & Evaluation, 10(7), 1-9.
Dávila de León, C., & Jiménez, G. (2014). Sentido de pertenencia y compromiso organizacional: predicción del bienestar. Revista de Psicología (PUCP), 32(2), 271-302. https://doi.org/10.18800/psico.201402.004
De Besa-Gutiérrez, M. R., Gil-Flores, J., & García-González, A. J. (2019). Variables psicosociales y rendimiento académico asociados al optimismo en estudiantes universitarios españoles de nuevo ingreso. Acta Colombiana de Psicología, 22(1), 152-163. https://doi.org/10.14718/ACP.2019.22.1.8
Drezner, N. D., & Pizmony-Levy, O. (2021). I belong, therefore, I give? The impact of sense of belonging on graduate student alumni engagement. Nonprofit and Voluntary Sector Quarterly, 50(4), 753-777. https://doi.org/10.1177/0899764020977687
Elosua, P. (2021). Aplicación remota de test: riesgos y recomendaciones. Papeles del Psicólogo, 42(1), 33-37. https://doi.org/10.23923/pap.psicol2021.2952
Fornell, C., & Larcker, D. F. (1981). Evaluating structural equation models with unobservable variables and measurement error. Journal of Marketing Research, 18(1), 39-50. https://doi.org/10.2307/3151312
Frías-Navarro, D. (2022). Apuntes de estimación de la fiabilidad de consistencia interna de los ítems de un instrumento de medida. Universidad de Valencia. https://www.uv.es/friasnav/AlfaCronbach.pdf
Gillen-O’Neel, C. (2021). Sense of belonging and student engagement: A daily study of first- and continuing-generation college students. Reserah in Higher Education, 62, 45-71. https://doi.org/10.1007/s11162-019-09570-y
Gopalan, M., & Brady, S. T. (2020). College students’ sense of belonging: A national perspective. Educational Researcher, 49(2), 134-137. https://doi.org/10.3102/0013189X19897622
Graham, C. W. & Moir, Z. (2022). Belonging to the university or being in the world: From belonging to relational being. Journal of University Teaching & Learning Practice, 19(4), Article 04. https://ro.uow.edu.au/jutlp/vol19/iss4/04
Gravett, K., & Ajjawi, R. (2022). Belonging as situated practice. Studies in Higher Education, 47(7), 1386-1396. https://doi.org/10.1080/03075079.2021.1894118
Hagerty, B. M., Williams, R. A., Coyne, J. C., & Early, M. R. (1996). Sense of belonging and indicators of social and psychological functioning. Archives of Psychiatric Nursing, 10(4), 235-244. https://doi.org/10.1016/S0883-9417(96)80029-X
Haim-Litevsky, D., Komemi, R., & Lipskaya-Velikovsky, L. (2023). Sense of Belonging, Meaningful Daily Life Participation, and Well-Being: Integrated Investigation. International Journal of Environmental Research and Public Health, 20(5), 4121. https://doi.org/10.3390/ijerph20054121
Hausmann, L. R. M., Schofield, J. W., & Woods, R. L. (2007). Sense of belonging as a predictor of intentions to persist among African American and White first-year college students. Research in Higher Education, 48(1), 803-839. https://doi.org/10.1007/s11162-007-9052-9
Hausmann, L. R. M., Ye, F., Schofield, J. W., & Woods, R. (2009). Sense of belonging and persistence in White and African American first-year students. Research in Higher Education, 48(1), 649-669. https://doi.org/10.1007/s11162-009-9137-8
Hu, L., & Bentler, P. (1999). Cutoff criteria for fit indexes in covariance structure analysis: Conventional criteria versus new alternatives. Structural Equation Modeling: A Multidisciplinary Journal, 6(1), 1-55. https://doi.org/10.1080/10705519909540118
International Test Commission. (2017). The ITC Guidelines for Translating and Adapting Tests (2nd ed.). www.InTestCom.org
Johnson, J. A. (2005). Ascertaining the validity of individual protocols from Web-based personality inventories. Journal of Research in Personality, 39(1), 103-129. https://doi.org/10.1016/j.jrp.2004.09.009
Katz, M. H. (2006). Multivariable analysis (2a ed.). Cambridge University Press.
Kuang, X., Mok, M. M. C., Chiu, M. M., & Zhu, J. (2019). Sense of school belonging: Psychometric properties and differences across gender, grades, and East Asian societies. PsyCh Journal, 8(4), 449-464. https://doi.org/10.1002/pchj.275
Krippendorff, K. (2011). Computing Krippendorff’s Alpha-Reliability. Annenberg School for Communication Departmental Papers. https://www.asc.upenn.edu/sites/default/files/2021-03/Computing%20Krippendorff%27s%20Alpha-Reliability.pdf
Lambert, N. M., Stillman, T. F., Hicks, J. A., Kamble, S., Baumeister, R. F., & Fincham, F. D. (2013). To belong is to matter: sense of belonging enhances meaning in life. Personality and Social Psychology Bulletin, 39(11), 1418-1427. https://doi.org/10.1177/0146167213499186
Lawshe, C. H. (1975). A quantitative approach to content validity. Personnel Psychology, 28, 563-575. https://doi.org/10.1111/j.1744-6570.1975.tb01393.x
Leary, M., Kelly, K., Cottrell, C., & Schreindorfer, L. (2013). Construct validity of the Need to Belong Scale: mapping the nomological network. Journal of Personality Assessment, 95(6), 610-624. https://doi.org/10.1080/00223891.2013.819511
Lloret-Segura, S., Ferreres-Traver, A., Hernández-Baeza, A., & Tomás-Marco, I. (2014). El análisis factorial exploratorio de los ítems: una guía práctica, revisada y actualizada. Anales de Psicología, 30(3), 1151-1169. https://doi.org/10.6018/analesps.30.3.199361
Malone, G., Pillow, D., & Osman, A. (2012). The General Belongingness Scale (GBS): Assessing achieved belongingness. Personality and Individual Differences, 52(3), 311-316. https://doi.org/10.1016/j.paid.2011.10.027
Maluenda-Albornoz, J., Bernardo, A. B., Díaz-Mujica, A., & Chacano-Osses, D. (2022a). Adaptación y evaluación psicométrica de la escala de Identificación Organizacional con Centros Educativos en estudiantado de ingeniería chileno. Cuaderno De Pedagogía Universitaria, 19(37), 144-156. https://doi.org/10.29197/cpu.v19i37.455
Maluenda-Albornoz, J., Bazignan, C., & Rojas, X. (2022b). Belonging to Engineering During the First Year in Online Education. 41st International Conference of the Chilean Computer Science Society (SCCC), 1-6. https://doi.org/10.1109/SCCC57464.2022.10000341
Maluenda-Albornoz, J., Berríos-Riquelme, J., Infante-Villagrán, V., & Lobos-Peña, K. (2023). Perceived Social Support and Engagement in First-Year Students: The Mediating Role of Belonging during COVID-19. Sustainability, 15(1), 1-10 https://doi.org/10.3390/su15010597
Mellor, D., Stokes, M., Firth, L., Hayashi, Y., & Cummins, R. (2008). Need for belonging, relationship satisfaction, loneliness, and life satisfaction. Personality and Individual Differences, 45(3), 213-218. https://doi.org/10.1016/j.paid.2008.03.020
Medrano, L. A., & Muñoz-Navarro, R. (2017). Aproximación conceptual y práctica a los modelos de ecuaciones estructurales. Revista Digital de Investigación en Docencia Universitaria, 11(1), 219-239. https://doi.org/10.19083/ridu.11.486
Muñiz, J., Elosua, P., & Hambleton, R. (2013). Directrices para la traducción y adaptación de los tests: segunda edición. Psicothema, 25(2), 151-157. https://doi.org/10.7334/psicothema2013.24
Novo, M., Redondo, L., Seijo, D., & Arce, R. (2016). Diseño y validación de una escala para la evaluación del sentido de comunidad en grupos académicos virtuales. Revista de Investigación en Educación, 14(2), 126-140.
Ostrove, J. M., & Long, S. (2007). Social Class and Belonging: Implications for College Adjustment. The Review of Higher Education, 30(4), 363-389. https://doi.org/10.1353/rhe.2007.0028
Pastor, Y., García-Jiménez, A., Pérez-Torres, V., López de Ayala, M., & Catalina-García, B. (2022). The Need to Belong Scale Revisited: Spanish validation, wording effect in its measurement, and its relationship with social networks use in adolescence. TMP - Testing, Psychometric, Methodology in Applied Psychology, 29(2), 241-255. https://doi.org/10.4473/TPM29.2.6
Patel, S., Shrisman, M., & Bennett, K. (2023). Development and psychometric testing of the Sense of Belonging in Nursing School (SBNS) Scale. Journal of Nursing Measurament, 31(1), 19-29. https://doi.org/10.1891/JNM-2021-0005
Pedler, M. L., Willis, R., & Nieuwoudt, J. E. (2022). A sense of belonging at university: student retention, motivation and enjoyment. Journal of Further and Higher Education, 46(3), 397-408. https://doi.org/10.1080/0309877X.2021.1955844
Pérez, E., & Medrano, L. (2010). Análisis factorial exploratorio. Bases conceptuales y metodológicas. Revista Argentina de Ciencias del Comportamiento, 2(1), 58-66.
Putnick, D. L., & Bornstein, M. H. (2016). Measurement invariance conventions and reporting: The state of the art and future directions for psychological research. Developmental Review, 41, 71-90. https://doi.org/10.1016/j.dr.2016.06.004s
Rojas-Andrade, R. M., Cabello, P., Leiva, L., & Castillo, N. (2019). Psychometric adaptation of the sense of community index (SCI-II) in Chilean public schools. Acta Colombiana De Psicología, 22(1), 273-284. https://doi.org/10.14718/ACP.2019.22.1.13
Roque, Y., & Quizhpi, L. R. (2022). Sentido de pertenencia en estudiantes universitarios ecuatorianos en tiempos de pandemia. Puriq, 4, e272. https://doi.org/10.37073/puriq.4.272
Rosseel, Y. (2012). lavaan: An R Package for Structural Equation Modeling. Journal of Statistical Software, 48(2), 1-36. https://doi.org/10.18637/jss.v048.i02
Satorra, A., & Bentler, P. M. (1994). Corrections to test statistics and standard errors in covariance structure analysis. En A. von Eye & C. C. Clogg (Eds.), Latent variables analysis: Applications for developmental research (pp. 399-419). Sage.
Suárez-Álvarez, J., Pedrosa, I., Lozano, L. M., García-Cueto, E., Cuesta, M., & Muñiz, J. (2018). El uso de ítems inversos en las escalas tipo Likert: una práctica cuestionable. Psicothema, 30(2),149-158.
Slaten, C. D., Elison, Z. M., Deemer, E. D., Hughes, H. A., & Shemwell, D. A. (2018). The development and validation of the university belonging questionnaire. The Journal of Experimental Education, 86(4), 633-651. https://doi.org/10.1080/00220973.2017.1339009
Slaton, C. R., Lammers, W., & Park, A. (2023). How school belongingness in diverse students moderates student perceptions of teachers’ cultural humility in predicting student–teacher working alliance. Psychology in the Schools, 60, 2360-2372. https://doi.org/10.1002/pits.22862
Strayhorn, T. L. (2012). College students’ sense of belonging: A key to educational success for all students. Routledge.
Strayhorn, T. L. (2018). College students’ sense of belonging: A key to educational success for all students (2nd ed.). Routledge.
Svetina, D., Rutkowski, L., & Rutkowski, D. (2020). Multiple-group invariance with categorical outcomes using updated guidelines: An illustration using Mplus and the lavaan/semTools packages. Structural Equation Modeling, 27(1), 111-130. https://doi.org/10.1080/10705511.2019.1602776
Tomás, J. M., Sancho Requena, P., Oliver Germes, A., Galiana Llinares, L., & Meléndez Moral, J. C. (2012). Efectos de método asociados a ítems invertidos vs. ítems en negativo. Revista Mexicana de Psicología, 29(2), 105-115.
Tristan, A. (2008). Modificación al modelo de Lawshe para el dictamen de validez de contenido de un instrumento objetivo. Avances en Medición, 6(1), 37-48.
Vaccaro, A., & Newman, B. M. (2017). A sense of belonging through the eyes of first-year LGBPQ students. Journal of Student Affairs Research and Practice, 54(2), 137-149. https://doi.org/10.1080/19496591.2016.1211533
Ventura-León, J. (2017). Intervalos de confianza para coeficiente Omega: Propuesta para el cálculo. Adicciones, 30(1), 77-78. https://doi.org/10.20882/adicciones.962
Verdam, M. G., Oort, F. J., & Sprangers, M. A. (2016). Using structural equation modeling to detect response shifts and true change in discrete variables: an application to the items of the SF-36. Quality of Life Research, 25(6), 1361-1383. https://doi.org/10.1007/s11136-015-1195-0
Walton, G. M., & Cohen, G. L. (2007). A question of belonging: Race, social fit, and achievement. Journal of Personality and Social Psychology, 92(1), 82-96. https://doi.org/10.1037/0022-3514.92.1.82
Williams, B., Onsman, A., & Brown, T. (2010). Exploratory factor analysis: A five-step guide for novices. Journal of Emergency Primary Health Care, 8(3), 1-13. https://doi.org/10.33151/ajp.8.3.93
Xu, L., Duan, P., Ma, L., & Dou, S. (2023). Professional identity and self-regulated learning: the mediating role of intrinsic motivation and the moderating role of sense of school belonging. SAGE open, 13(2). https://doi.org/10.1177/21582440231177034
Yáñez, R., Pérez, M. V., & Ahumada, L. (2006). Adaptación y validación de una escala de identificación organizacional con centros de estudio. Paideia, 41(1), 65-76.
Yeager, D. S., Walton, G. M., Brady, S. T., Akcinar, E. N., Paunesku, D., Keane, L., Kamentz, D., Ritter, G., Duckworth, A. L., Urstein, R., Gomez, E. M., Markus, H. R., Cohen, G. L., & Dweck, C. S. (2016). Teaching a lay theory before college narrows achievement gaps at scale. Proceedings of the National Academy of Sciences, 113, E3341–E3348. https://doi.org/10.1073/pnas.1524360113
Disponibilidad de datos: El conjunto de datos que apoya los resultados de este estudio no se encuentra disponible.
Cómo citar: Correa-Rojas, J., Grimaldo, M., Valdivia Vizarreta, P., & Del Águila-Chávez, M. (2024). Adaptación y análisis de la estructura interna de la Escala de Sentido de Pertenencia Universitaria (ESPU) en estudiantes peruanos. Ciencias Psicológicas, 18(1), e-3498. https://doi.org/10.22235/cp.v18i1.3498
Contribución de los autores (Taxonomía CRediT): 1. Conceptualización; 2. Curación de datos; 3. Análisis formal; 4. Adquisición de fondos; 5. Investigación; 6. Metodología; 7. Administración de proyecto; 8. Recursos; 9. Software; 10. Supervisión; 11. Validación; 12. Visualización; 13. Redacción: borrador original; 14. Redacción: revisión y edición.
J. C.-R. ha contribuido en 1, 2, 4, 5, 6, 11, 12, 13; M. G. en 1, 3, 5, 7, 9, 10, 13; P. V. V. en 3, 5, 10, 13, 14; M. del A.-C. en 5, 8, 10, 13, 14.
Editora científica responsable: Dra. Cecilia Cracco.
10.22235/cp.v18i1.3498
Original Articles
Adaptation and Analysis of the Internal Structure of the Sense of Belonging at University Scale (SBUS) in Peruvian Students
Adaptación y análisis de la estructura interna de la Escala de Sentido de Pertenencia Universitaria (ESPU) en estudiantes peruanos
Adaptação e análise da estrutura interna da Escala de Pertencimento à Universidade (ESPU) em estudantes peruanos
Jossué Correa-Rojas1, ORCID 0000-0002-4166-7210
Mirian Grimaldo2, ORCID 0000-0003-4197-1906
Paloma Valdivia-Vizarreta3, ORCID 0000-0003-1499-5478
Monica Del Aguila-Chávez4, ORCID 0000-0001-7538-7519
1 Universidad Peruana de Ciencias Aplicadas, Peru, [email protected]
2 Universidad Peruana de Ciencias Aplicadas, Peru
3 Universidad Autónoma de Barcelona, Spain
4 Universidad Marcelino Champagnat, Peu
Abstract:
The sense of belonging refers to the experience of participation in a system or environment in such a way that each member feels an integral part of that system. This attribute is of interest in different educational environments of different levels, however, there are no measures that allow its correct measurement. The purpose of the study was to adapt and analyze the internal structure of the Sense of Belonging Scale in Peruvian university students (SBUS). For this, we worked with a convenience sample made up of 827 university students, divided into two groups, one of 220 students (68.6 % women) with an average age equal to 21.68 years (SD = 4.87), with which the exploratory factorial analysis was carried out. The second group consisted of a total of 607 participants (69.7 % women) with an average age of 21.28 (SD = 4.21) years, with which confirmatory factor analyzes were performed. The results show the linguistic adaptation, appreciating an adequate inter-observer agreement (RVC > .70). The exploratory factor analysis suggests a two-factor structure (χ2 = 646.750; df = 36.00; p < .001) that explains 41.2 % of the variance; this structure was corroborated by a confirmatory factor analysis, which reached adequate fit indices (CFI = .998; TLI = .996; RMSEA = .048). The reliability of the scale was determined by internal consistency, finding omega coefficients ranging between .665 and .929. In summary, the SBUS is an instrument with adequate evidence of validity and reliability to measure the sense of belonging.
Keywords: sense of belonging; university students; confirmatory factor analysis; validity; education.
Resumen:
El sentido de pertenencia hace referencia a la experiencia de participación en un sistema o entorno de tal manera que cada miembro se sienta parte de ese sistema. Este atributo es de interés en el ámbito educativo de distintos niveles, sin embargo, no se cuenta con un instrumento que permita su medición en el medio. El propósito del estudio fue adaptar y analizar la estructura interna de la Escala de Sentido de Pertenencia en universitarios peruanos (ESPU). Se trabajó con una muestra por conveniencia compuesta por 827 universitarios, dividida en dos grupos uno de 220 estudiantes (68.6 % mujeres) con una edad promedio de 21.68 años (DE = 4.87), con la cual se realizó el análisis factorial exploratorio. El segundo grupo estuvo conformado por un total de 607 participantes (69.7 % mujeres) con una edad promedio de 21.28 (DE = 4.21) años, con el cual se realizaron los análisis factoriales confirmatorios. Los resultados dan cuenta de la adaptación lingüística, apreciándose un acuerdo inter-observadores adecuado (RVC > .70). El análisis factorial exploratorio sugiere una estructura de dos factores (χ2 = 646.750; gl = 36.00; p < .001) que explica el 41.2 % de la varianza; esta estructura fue corroborada mediante un análisis factorial confirmatorio que alcanzó índices de ajuste adecuados (CFI = .998; TLI = .996; RMSEA = .048). La fiabilidad de la escala se determinó por consistencia interna encontrándose coeficientes omegas que van entre .665 y .929. En suma, la ESPU es un instrumento con adecuadas evidencias de validez y fiabilidad para medir el sentido de pertenencia.
Palabras clave: sentido de pertenencia; estudiantes universitarios; análisis factorial confirmatorio; validez; educación.
Resumo:
O sentimento de pertencimento refere-se à experiência de participação em um sistema ou ambiente de forma que cada membro se sinta parte integrante desse sistema. Este atributo é de interesse no âmbito educativo em distintos níveis, entretanto, não existem instrumentos que permitam sua mensuração nesse meio. O objetivo do estudo foi adaptar e analisar a estrutura interna da Escala de Sentido de Pertencimento em estudantes universitários peruanos (ESPU). Trabalhou-se com uma amostra de conveniência composta por 827 universitários, divididos em dois grupos, um de 220 estudantes (68,6 % mulheres) com média de idade de 21,68 anos (DP = 4,87), com o qual foi realizado uma análise fatorial exploratória. O segundo grupo foi composto por um total de 607 participantes (69,7 % mulheres), com média de idade de 21,28 anos (DP = 4,21), com o qual foram realizadas análises fatoriais confirmatórias. Os resultados mostram a adaptação linguística, apreciando-se uma adequada concordância interobservadores (RVC > 0,70). A análise fatorial exploratória sugere uma estrutura de dois fatores (χ2 = 646,750; gl = 36,00; p < 0,001) que explica 41,2 % da variância; esta estrutura foi corroborada pela análise fatorial confirmatória, que alcançou índices de ajuste adequados (CFI = 0,998; TLI = 0,996; RMSEA = 0,048). A confiabilidade da escala foi determinada pela consistência interna, sendo encontrados coeficientes ômega entre 0,665 e 0,929. Em suma, a ESPU é um instrumento com evidências adequadas de validade e confiabilidade para medir o sentimento de pertencimento.
Palavras-chave: sentimento de pertencimento; estudantes universitários; análise fatorial confirmatória; validade; educação.
Received: 28/06/2023
Accepted: 23/05/2024
In the educational field, the Sense of Belonging at University (SBU) is defined as the affective, cognitive, and social perception concerning the university in which a person studies (Dávila de León & Jiménez, 2014). The SBU combines the development of feelings or sensations of connection experienced by the student when feeling accepted, respected, valued, and important to the group and the university (Strayhorn, 2018).
Ahn and Davis (2020) developed a structured classification; their analysis of students’ sense of belonging at university is multidimensional, defining four domains independent from each other: academic engagement, social, environment (geographical location, natural space, living spaces, and cultural aspects), and personal space (the area of self-identification, self-esteem, and life satisfaction). Belonging at university varies according to institutional and student characteristics, as shown by the studies of Gopalan and Brady (2020), who highlight that racial and ethnic minority and first-year (freshmen) students report a lower sense of belonging than their fourth-year peers. Also, the study conducted by Vaccaro and Newman (2017) analyzes the creation of a sense of belonging in first-year LGBTQ students. Furthermore, Walton and Cohen (2007) found that social belonging at university increases the academic performance of underrepresented ethnic groups.
Different research on the contributions of SBU suggests that students who have a greater sense of belonging tend to develop higher motivation and persistence (Strayhorn, 2012; Yeager et al., 2016), more academic self-confidence (Hausmann et al., 2007), higher levels of academic engagement (Davila & Jimenez, 2014; Gillen-O’Neel, 2021; Ostrove & Long, 2007), higher achievement (Aramendiz & Delgadillo, 2021; De Besa-Gutiérrez et al., 2019; Pedler et al., 2022; Strayhorn, 2018; Walton & Cohen, 2007) and allows identifying students involved in the activities proposed by the institution, being them who have a better relative assessment of the institution (Roque & Quizhpi, 2022).
Consequently, Patel et al. (2023) point out that the sense of belonging is essential for human motivation and can even influence how people develop professionally. According to Dávila de León and Jiménez (2014), SBU constitutes a predictor of general well-being. Thus, for example, in the case of graduates, the SBU stays with them. Moreover, it has been found that they maintain philanthropic attitudes towards their alma mater, also associated with commitment and participation in volunteer work (Drezner & Pizmony-Levy, 2021).
Likewise, Xu et al. (2023) report that university students with a high sense of belonging show a greater influence of professional identity and intrinsic motivation in improving their self-regulated learning capacity. However, Gravett and Ajjawi (2022) qualify these SBU approaches as traditional by considering it a universally positive, uniform experience and a fixed state of being. For this purpose, they contextualize the aftermath of the COVID-19 pandemic, in which the crisis highlighted the fluidity, limitations, and change of institutions, leading to a more nuanced conception of where and when students belong. Graham and Moir (2022) made another thoughtful contribution, when they expressed the need for authentic relevance; this stems from their concern about the prevalence of belonging pedagogy as an experience focused more on “fitting into the system” than focusing on a university under construction that emerges and exists through the interrelationships of those involved, i.e., how faculty and students constitute ecosystems and communities.
The above-mentioned issues highlight the relevance of the study of the sense of belonging at university since it evidently constitutes a predictor not only of academic performance but also of adjustment to university environment and, therefore, a protective factor against academic dropout (Ostrove & Long, 2007). However, the study of this construct has not been explored widely in Peru. This is due to the absence of a valid and reliable instrument to measure it. The literature review shows the scarcity of instruments that measure SBU, since most of them are applied to schoolchildren (Kuang et al., 2019; Slaten et al., 2018) and to other contexts specific to professional development (Patel et al., 2023; Rojas-Andrade et al., 2019).
Regarding the measures, the following was found: Hagerty et al. (1996) designed and validated the Sense of Belonging Instrument (SOBI) in three samples, one of university students, another of patients under treatment for major depression, and another of Catholic nuns. Initially, content-based validity was verified, which reached a Content Validity Index (CVI) equal to .83. To determine the structural validity of the measure an exploratory factor analysis (EFA) was used with the principal component analysis. Despite its usefulness, this is not a measure that allows the identification of belonging to an institution; rather, it explores the psychological state of the general sense of belonging and the desire or ability to develop this attribute.
In Latin America, this work found a scale to measure the sense of community in virtual social network groups (Novo et al., 2016) developed in Spain, whose structural validity was reported using a principal components EFA; a procedure currently discouraged (Lloret-Segura et al., 2014). In Chile, Rojas-Andrade et al. (2019) adapted the Sense of Community Scale (SCI-II) originally developed by Chavis et al. (2008) in a sample of high school students; the findings allowed corroborating the structure of three dimensions of the construct (connectedness, valued belonging, and membership-reciprocity); however, the sense of community is not equivalent to the sense of belonging.
Recently, other instruments have been proposed to measure the sense of belonging. Thus, Slaten et al. (2018) created the University Belonging Questionnaire on a sample of American undergraduates. The measure is comprised of 24 items distributed into three factors: university affiliation, university support and acceptance, and relationships with faculty and staff. However, the fit indices of the three-factor model were barely acceptable (CFI = .92; TLI = .93; RMSEA = .05), despite applying a strong maximum likelihood estimator.
Likewise, Checa and Oberts (2021) adapted Malone’s (2012) General Belongingness Scale (GBS) to a sample of Spanish adults between 17 and 73 years old, although the results demonstrate the structural solvency (ECV = 0.825; CR = 0.914) and the consistency of its scores (α = .917), this instrument does not measure the sense of university belonging and it instead focuses on analyzing the degree to which people have satisfied their need for belonging and have achieved a general sense of belonging. Furthermore, Pastor et al. (2022) adapted Leary et al.’s (2013) Need to Belong Scale (NBS) to Spanish on a sample of 540 adults. The results showed that the NBS achieved acceptable fit indices but the models tested showed problems in the factor loadings due to the presence of inversely worded items; such structure improved when excluding these items (CFI = .98; NNFI = .97; AIC = 59.27). It should be emphasized that this instrument does not measure the sense of university belonging; what it really measures is the need to belong as a form of motivation that drives the building of interpersonal relationships.
There are other instruments such as the Scale of Organizational Identification with Educational Centers and the Scale of Organizational Identification with Study Centers; the first was validated by Maluenda-Albornoz et al. (2022a) and the second, by Yáñez et al. (2006). Although both instruments measure identification, the first adopts a conceptualization of belonging as that of a person who is part of an organization; whereas, the second instrument measures the student’s identification with his or her degree program, not with the institution.
Thus, the instruments mentioned measure some specific aspect of identification with the professional activity, or with the organization from the perspective of a member of the institution’s staff. However, there is a need to learn about the sense of belonging as a psychological experience in terms of valued participation and person-environment adjustment of university students, and how it can promote well-being and even reduce the levels of academic desertion (Maluenda-Albornoz et al., 2023).
Additionally, Akar-Vural et al. (2013) designed the Sense of Belonging Scale, initially aimed at Turkish adolescents, which measures the sense of belonging to school. Its underlying theoretical model comprises two dimensions: the first called Contentment in School, which refers to the pride and happiness of being part of the institution, and the second Obedience of School Rules, which addresses compliance with the rules established by the institution. The results of the confirmatory factor analysis (CFA) corroborated this bifactorial structure, finding satisfactory fit indices (CFI = .98; NNFI = .97; RMSEA = .059).
The search for instruments to measure SBU led the research team to choose the Sense of Belonging Scale (Akar-Vural et al., 2013) as a measure that has theoretical support since the conceptualization of the construct takes into account its multidimensional nature and the psychological experience as such, given that it considers identification, security, and perceived emotional support (Dávila de León & Jiménez, 2014), all of which require time to develop; even age may lead to its consolidation (Hagerty et al., 1996).
The main purpose of the present study was to adapt and analyze the evidence of validity and reliability of the Sense of Belonging Scale in a sample of Peruvian undergraduates. Specifically, the scale was adapted to Spanish using the interobserver agreement procedure (back translation). Then, internal structure validity was explored. In addition, factorial invariance according to age was verified and, finally, the internal consistency of the scores was reported.
Method
Participants
This is an instrumental design study (Ato et al., 2013), in which 827 students from a private university in Peru participated, all chosen by convenience, due to their accessibility. For the purpose of the study, this sample was divided into two groups; exploratory analyses of the internal structure were performed on the first group. This sample comprised 220 students, 68.6 % women with an average age equal to 21.68 years (SD = 4.87). The second group included a total of 607 male (30.3 %) and female (69.7 %) participants with an average age of 21.28 years (SD = 4.21). A total of 49.1 % were 20 years old or younger and 50.9 % were 20 years old or older, from the study programs of psychology (30.70 %), administration (26.5 %), education (25.5 %), engineering (10.5 %), and communications (6.8 %) from a campus located in Metropolitan Lima. All correspond to socioeconomic level C (middle class) and have sociocultural characteristics in common.
Instruments
Sense of Belonging Scale (SBS; Akar-Vural et al., 2013). It is a self-reporting instrument with 10 items that measure the sense of belonging to the school in two dimensions: Contentment in School (items 1, 2, 3, 4 and 5), which refers to identification with the school, and Obedience of School Rules (items 6, 7, 8, 8, 9 and 10), which addresses disobedience of the institution’s rules. The SBS items present a Likert-type response scaling of five response options ranging from 1: strongly disagree to 5: strongly agree. The psychometric properties of the measure were analyzed using an EFA with the principal component method and varimax rotation; the assumptions of sample adequacy (KMO = 0.86) and item intercorrelation (χ2 = 1,526.71; df = 45; p < .001) were verified. The two-factor structure explained 60.72 % of the variance and the factor loadings range from 0.68 to 0.86. Subsequently, through a CFA with the maximum likelihood method, the bifactor structure was corroborated. Factor 1: Contentment in School and Factor 2: Obedience of School Rules, which obtained adequate fit indices (χ2 = .80.93; p < .001; CFI = .98; NNFI = .97; RMSEA = .059). Validity was also verified about other variables, identifying significant positive correlations with the scores of the Scale of Perceived Social Support and negative and significant correlations with the scores of the UCLA Loneliness Scale; as for reliability, alpha coefficients above .70 were reported, which corresponds to adequate values.
For this research, the items were adapted from English to Spanish; in addition, the discursive reality of the items was adapted to a university context; for this, the guidelines of the International Test Commission (ITC, 2017) were followed; the work had the advice of two translators with experience in these procedures who were entrusted with the process of translating the items (back translation).
Table 1: Linguistic Adaptation of SBS
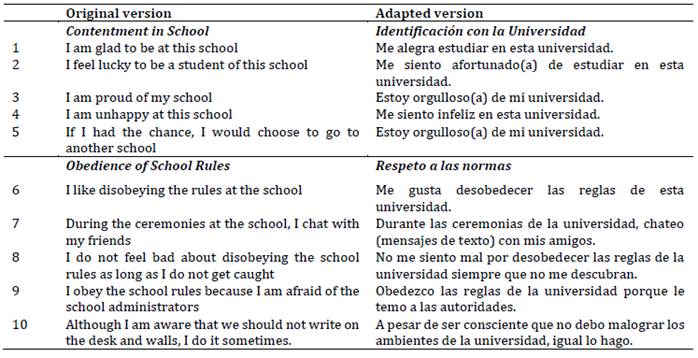
Procedures
The data collection was carried out in the last semester of 2021 and the first months of 2022 on a sample of undergraduates. It was done remotely through a Google Form that was sent by different means: via personal and institutional e-mail. This form includes the informed consent where the objective of the study and the voluntary nature of the participation are explained, and the anonymity of the participants is guaranteed. To mitigate the risks of the remote application of the test, the recommendations of Elosua (2021) were followed: the information collected was secured, a backup copy of the data was generated, and instructions were provided so that participants filled out the forms in private. The research team ensured that the evaluation conditions facilitated the participants’ responses and the confidentiality and anonymity of the participants were guaranteed throughout the research process (American Educational Research Association et al., 2018).
Data Analysis
The statistical analysis was performed with the IBM SPSS pack 25, which was used to perform the descriptive analysis of the items and the EFA; and with RStudio version 1.1.456, specifically with the lavaan library (Rosseel, 2012) to perform the CFA. The statistical analysis was performed in phases. The absence of outliers and missing data was verified; the assumption of normality was checked using skewness (g1) and kurtosis (g2) coefficients: values ± 1.5 were taken as a range to estimate a normal distribution (Medrano & Muñoz-Navarro, 2017; Pérez & Medrano, 2010).
The Content Validity Ratio (CVR) proposed by Lawshe (1975) and later modified by Tristan (2008) was used to verify the interobserver agreement index. Its choice responded to the need for verification in a range of dichotomous variables (agreement/disagreement) by the observers regarding the equivalence of the translations made: values above 0.50 suggest acceptable agreement.
An EFA was performed to verify the sample adequacy and intercorrelation of the items, using the Weighted Least Squares (WLS) method with promax rotation. Then, a CFA was performed with the Weighted Least Square Mean and Variance Adjusted (WLSMV) method, due to the categorical nature of the data (Verdam et al., 2016), factor loadings of 0.40 were considered adequate (Williams et al., 2010). An adjustment to the χ2 statistics was applied to attenuate the effect of non-normality (Satorra & Bentler, 1994; SB χ2).
The fit indices reviewed were the chi-square ratio between degrees of freedom (χ2/df) with expected values below 3, Root Mean Square Error of Approximation (RMSEA) and Standardized Root Mean Square Residual (SRMR) in both cases values below 0.08 suggested by Bentler and Bonnet (1980) were expected. The Comparative Fit Index (CFI) and Tucker-Lewis Index (TLI) were included with acceptable values above 0.95 (Hu & Bentler, 1999). From the factor loadings of both models, the Average Variance Extracted (AVE) was calculated, with satisfactory values of around 0.50; as a result, the evidence of convergent internal validity was verified (Fornell & Larcker, 1981). Additionally, the Composite Reliability (Composite Reliability Coefficient (RC)) was reported, with values above .70 being acceptable. Also, the configurational, metric, strong, and strict invariance was verified for which changes ΔCFI ≤.01, and ΔRMSEA ≤.015 were considered to establish invariance (Byrne, 2008; Putnick & Bornstein, 2016).
Finally, the internal consistency method was used to verify the reliability of the SBUS, and the omega coefficient was calculated based on the ordinal nature of the variables (Katz, 2006; Ventura-León, 2017).
Results
Translation and Linguistic Adaptation
To verify the relevance of the translation (English-Spanish), three translators with experience in this type of procedure were asked whether they agreed (1) or disagreed (0) with the quality of the translation. The agreement with the responses was verified using the CVR coefficient, with values ranging from 0.667 to 1.000 (see Table 2).
This procedure was replicated to evaluate the translation from Spanish to English (back translation) and the agreement indices showed similar behavior (CVR > 0.66). Additionally, three higher-education and educational psychology experts were asked to observe the adequacy of the language used for each adapted item. Additionally, it was decided to change the word “school” (escuela) to “university” (universidad), and 100 % agreement was reached on all items.
Table 2 shows the agreement indices for the translation from English to Spanish, the back translation and the linguistic adaptation of the SBUS. Furthermore, a sample of 20 students was surveyed on the comprehension of the questions and the correspondence with the answer alternatives; overall, the answers were favorable.
Table 2: Indices of Agreement for Linguistic Adaptation
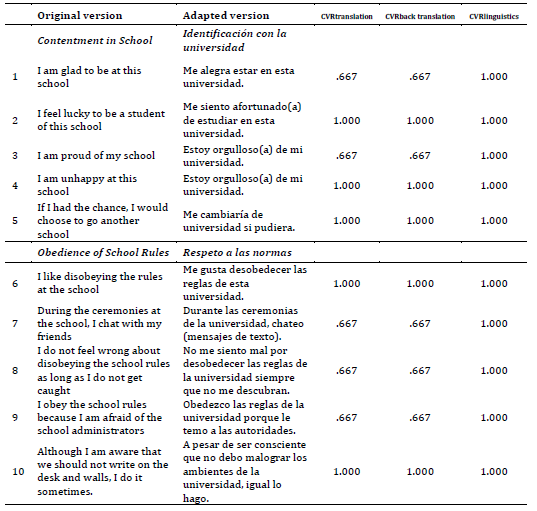
Notes: Index according to Lawshe (1975) and modified by Tristan (2008), appropriate values from 0.51 onwards.
Descriptive and Distributional Statistics
Table 3 shows the descriptive statistics of the SBS for both samples. For sample 1, the average ranges between 3.07 and 4.36 with a variability that fluctuates between 0.78 and 1.37. Regarding sample 2, the mean scores range between 3.081 and 4.316; the skewness coefficients suggest a negative skewness in most of the items; whereas the kurtosis coefficients denote that the largest proportion present a platykurtic distribution, except for items 4, 2, 7, and 9, which presents a leptokurtic distribution. Also, the frequencies of the response alternatives are reported, which is considered a statistic that allows the interpretation of a set of variables of ordinal nature. These values show a more accentuated distribution towards alternatives 4 and 5. The corrected item-test correlations were calculated for the sample of 607 participants, and these show that most of the items are above .20, except for item 9.
Table 3: Descriptive Statistics of the Sense of Belonging Scale
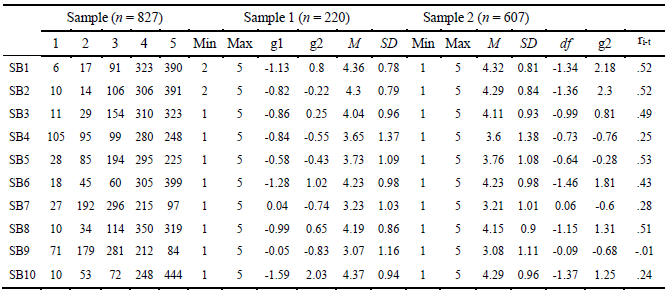
Evidence of Validity Based on Internal Structure
The EFA was conducted on a sample of 220 participants, the sample adequacy index was .789 which is acceptable; likewise, the intercorrelation of the items was adequate (χ2 = 646.750; df = 36.00; p < .001). The factor loadings found in the first factor (27.9 %) range from 0.659 to 0.870, it was found that item 4 does not saturate adequately; as for the second factor (13.3 %), the loadings fluctuate between .256 and .622. This exploratory model explained 41.2 % of the variance (see Table 4).
Table 4: Exploratory Factor Analysis for the SBS
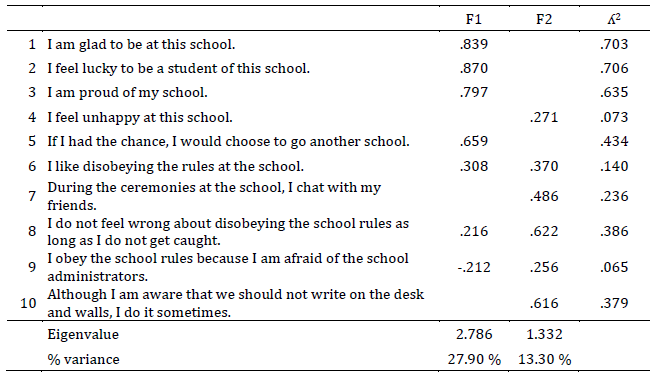
Note: Weighted Least Squares (WLS) extraction method with promax rotation.
Confirmatory Factor Analysis
Based on the information obtained in the EFA, four confirmatory models were analyzed (see Table 5). In two-dimensional Model 1, factor loadings above 0.40 were found, except for items 4 and 9, with partially adequate fit indices (SB χ2/34 = 8.27; CFI > .95). In Model 2, items 4 and 9 are excluded, thereby increasing factor loadings, but fit indices do not improve substantially (SB χ2/19 = 7.57; CFI > .95); additionally, the squared factor loading (ʎ2) has been included to expose a more accurate measure of the item’s association with its respective factor, it can be verified since items 4, 5, 9, and 10 present values below .40, indicating that the specific variance of these items is too high.
Table 5: Confirmatory Models of the SBUS
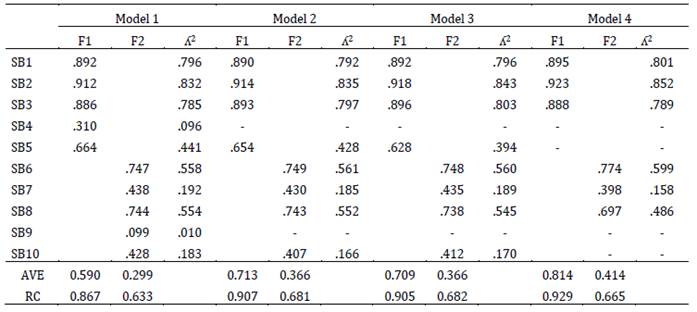
Notes: Model 1: original two-dimensional model; Model 2: two-dimensional model without items 4 and 9; Model 3: two-dimensional model without items 4, 9 and with a correlated error between items 5 and F2; Model 4: two-dimensional model without items 4, 5, 9 and 10.
After reviewing the modification indices, we propose Model 3—two-dimensional model without items 4, 9 and with a correlated error between item 5 and the second factor—where the factor loadings improve and the fit indices are partially satisfactory (SB χ2/18 = 4.04; CFI > .99). However, the correlation of item 5 with the second factor is theoretically inadequate. Thus, in Model 4 (two-dimensional model without items 4, 5, 9, and 10), the fit indices result is satisfactory (SB χ2/8 = 2.37; CFI > .99).
Likewise, the Average Variance Extracted (AVE) was calculated to evaluate the convergent reliability of the factors identified, identifying that the AVE values of factor 2, which correspond to compliance with school rules, have values below what is expected (< .50); however, model 4 has the highest value of this coefficient. The same applies to the values of the Composite Reliability (CR) coefficient. In Model 1, for the first factor, it was equal to .867; for the second factor, a coefficient equal to .633 was found, which shows that the measure presents an adequate consistency in its scores. For the remaining models, this behavior was maintained, yielding higher measures for the first factor. Thus, in Model 4, the first factor reached a CR = 0.929 and for the second factor, it was 0.665.
Table 6 shows the fit indexes for the models analyzed. It can be observed that the comparative indexes suggest that Model 4 presents the most parsimonious and coherent structure, in comparison with Model 3, since it suggests the displacement of an item that theoretically was conceived for a different factor.
Table 6: Fit Indices of the Measurement Model
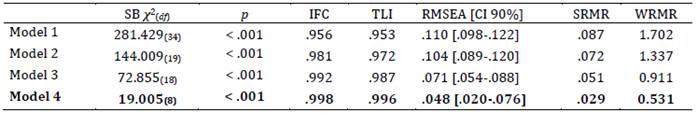
Note: SB χ2: Satorra-Bentler chi-square.
Factorial invariance by age and sex
In Table 7, once Model 4 was identified as the best internal structure, the factorial invariance by age and sex was analyzed. In this regard, the results allow us to conclude that the SBUS presents configurational, metric, scalar, and strict invariance. When the configurational invariance is corroborated, this indicates that the same items or factors are present in all samples, although the specific values of the parameters may vary. Regarding metric invariance, the results show that the strength of the relationships between the items or factors and the construct is constant in both samples. Regarding scalar invariance, it refers to the equality of the variance of the measurement errors of the items or factors across all groups or conditions. As for strict invariance, the results indicate that the items or factors measure the same construct for all groups and that the loadings of the items or factors are equal in all groups. In sum, the invariance at these four levels suggests that the measurement instrument is valid and reliable for use in different groups or conditions since it consistently measures the same construct similarly for all of them.
Table 7: Factorial Invariance of the SBUS According to Age and Sex Group
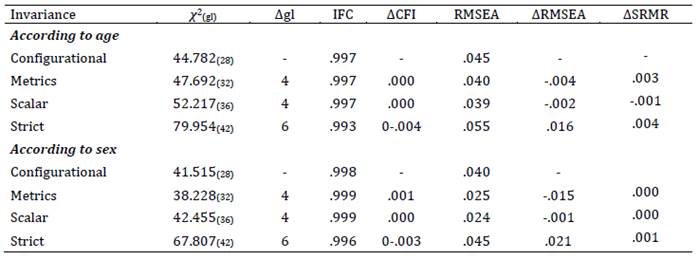
Evidence of Reliability
The reliability of the SBUS was estimated for Models 1, 2 and, 4. For the first model, factor 1 reaches an omega coefficient equal to .809, while factor 2 reaches a coefficient equal to .576. In the second model, omega coefficients equal to .864 and .593 were reached for factors 1 and 2, respectively. In Model 4, the reliability values were .883 (first factor) and .571 (second factor). As shown, the reliability values of the first factor are adequate in all the models tested; however, the second factor barely reached measures above .50, which suggests that its scores are not consistent.
Discussion
The sense of belonging in undergraduates refers to the identification with the institution where they study, an important attribute for adequate academic performance (Hagerty et al., 1996). This study is relevant since it favors the potential of students (Aramendiz & Delgadillo, 2021; De Besa-Gutierrez et al., 2019; Hausmann et al., 2009), it is related to adaptation to university life (Ostrove & Long, 2007) and with general well-being (Dávila de León & Jiménez, 2014).
The purpose of this study was to linguistically adapt and analyze the internal structure of the Sense of Belonging Scale (Akar-Vural et al., 2013) on a sample of undergraduates. The results show that the translation procedure was carried out according to ITC’s guidelines (2017), and the linguistic adaptation carried out in which the word “escuela” (school) was replaced with “universidad” (university) did not alter the content of the measure; additionally, it positively affected the understanding of the items in the Peruvian university context. The procedure allowed for verifying the semantic adequacy of each item, and good agreement indices were obtained (Muñiz et al., 2013).
Concerning the structural validity of the SBUS, it was determined that, of the four models analyzed, Model 4 proved to be the most pertinent. For its analysis, the items that presented unstable behaviors were eliminated, among them item 4 (“I am unhappy at this school”), item 5 (“If I had the chance, I would choose to go another school”), item 9 (“I obey the school rules because I am afraid of the school administrators”) and item 10 (“Although I am aware that we should not write on the desk and walls, I do it sometimes”), improving the efficiency of the measure and resulting in a parsimonious, coherent, and interpretable structure (Fornell & Larcker, 1981).
The elimination of these four items may alter the theoretical content of the SBUS; however, this decision was made after considering that the wording of the items was confusing. This decision can be supported by documentation on the effect of negatively worded items, and current suggestions point to not including them in Likert-type measures (Suárez-Álvarez et al., 2018; Tomás et al., 2012). In addition, having three items per factor can be supported by authors such as Frías-Navarro (2022) and Costello and Osborne (2005), who point out that the inclusion of three items per factor constitutes a sufficient size for an adequate measurement of an attribute, even for the calculation of its reliability.
These differences found in the internal structure, as well as elimination of items from the original version developed by Akar-Vural et al. (2013) may be due mainly to cultural issues, specifically to the participants’ ability to understand texts, as reflected in the low factor loadings obtained by the negatively worded items. As could be seen reflected in items 4 (“I am unhappy at this school”) and 5 (“If I had the chance, I would choose to go another school”).
Another reason that may have implications on the results is the assessment that can be made on the compliance with school rules dimension of the sense of university belonging, because the reliability of this dimension is well below expectations. In general, Latin American countries have a negative expectation of their authorities, which leads them to question them constantly. The undergraduates surveyed may have this pattern ingrained which is evident from the inconsistent results obtained, which are reflected in an insufficient response effort (careless) (Johnson, 2005). This perspective on authorities is different in Europe, which may generate less bias or social desirability in their responses.
Based on the statistical analyses performed, a short version of the SBUS (Model 4) was obtained, preserving the underlying theoretical structure on which it was developed and obtaining even better fit indices than the original version (Akar-Vural et al., 2013). Thus, the first factor, called contentment in school, and the second, obedience of school rules, are maintained. This corroborates the multidimensional nature of the construct, which has been presented in other measures (Hagerty et al., 1996; Chavis et al., 2008; Rojas-Andrade et al., 2019; Slaten et al., 2018). However, it should be noted that although initially the SBUS can be used to measure the sense of belonging at university, this does not imply that it contains all the necessary components for a deep approach to the sense of belonging, because as described, belonging arises from a sense of connection with the institution (identification), feeling valued and respected, and also by feeling somehow accountable to the institution.
Likewise, it was possible to establish the factorial invariance of the measure according to age and sex (Model 4), which indicates that the SBUS does not introduce measurement biases for this attribute in Peruvian undergraduates (Byrne, 2008). By corroborating configurational, metric, scalar, and strict invariance we demonstrate that the internal structure is solvent, that the items measure the factor in which they are related to one another, and that the strength of the relationships between the items or factors and the construct is constant by both age and sex (Putnick & Bornstein, 2016). In sum, the invariance at these four levels suggests that the measurement instrument is valid and reliable for use across different groups or conditions, as it consistently measures the same construct similarly across them (Svetina et al., 2020).
Reliability was calculated using the omega coefficient since it is a more efficient measure for ordinal variables. The findings suggest that the SBUS scores are consistent for the first factor and present barely inadequate values for the second factor. These findings were relatively superior to those reported in the study by Akar-Vural et al. (2013). Notwithstanding, we need to consider interpretation of an additional coefficient—the composite reliability coefficient (RC), which is derived from the factor loadings—which obtains adequate values in all factors of the tested models. This discrepancy in the calculation of the coefficients could lead to further investigation in order to establish the reason for these discrepancies. If only the omega values are considered—which stand below .667 for the second factor of compliance with rules (Krippendorff, 2011)—this discrepancy may be due to problems in the understanding of the statements or insufficient response effort due to the nature of the construct.
The practical implications of this research are related to the contribution of a measure that will allow studying the sense of belonging in the university environment. Since it is a construct about adjustment to university life (Ostrove & Long, 2007), academic performance (Aramendiz & Delgadillo, 2021), strengthening of professional training (Corona, 2020), and identification of students involved with the activities proposed by the university, it helps them to develop a more favorable attitude towards the institution (Roque & Quizhpi, 2022) and guides people’s sense of life (Lambert et al., 2013). However, a deeper study of the instrument’s reliability is required to identify whether the low reliability values are due to a method issued associated with the wording of negative items which are predominant in the second factor. Additionally, this measurement needs to be taken cautiously bearing in mind that this is a first study and that further analysis is required to obtain a measure that has greater internal consistency.
In summary, we obtain a brief version of the SBUS comprised of six items distributed among two factors: contentment in school (“I am glad to be at this university”, “I feel lucky to be a student of this university”, “I am proud of my university”) and obedience of school rules (“I like disobeying the rules at this university”, “During ceremonies at the university, I chat with my friends”, “I do not feel wrong about disobeying the university rules as long as I do not get caught”). In this sense, the analysis of the item content and their dimensions is consistent with the conceptualization of the sense of belonging that has been presented in this study, since this is understood as the psychological experience in terms of valued participation and person-environment adjustment of undergraduates (Maluenda-Albornoz et al., 2022b; Maluenda-Albornoz et al., 2023).
Moreover, the SBU alludes to an affective, cognitive, and social perception concerning the university in which a person studies (Dávila de León & Jiménez, 2014). Therefore, the SBUS’ items combine feelings or sensations of connection, which are reflected in the first factor; while the second factor presents elements such as the experiences of acceptance that arise from the acceptance of the rules of coexistence, which manifest themselves when one feels accepted, respected, valued, and important in the group and university (Strayhorn, 2018). Nevertheless, the inclusion of negatively worded items that explore compliance with rules may have had a counterproductive effect seen in the results already discussed. Further study of the instrument and of aspects such as the conceptual equivalence and the revision of item content in subsequent studies is crucial.
The main limitation of the study lies in the non-probabilistic nature of the selected sample, which means that the results must only be considered in terms of its limited generalizability and can only be interpreted for similar sociocultural contexts. Another limitation of the study is that other forms of evidence validity—such as the relationship with other constructs—were not explored, rendering it essential to carry out future research to complement these findings.
References:
Ahn, M. Y., & Davis, H. H. (2020). Four domains of students’ sense of belonging to university. Studies in Higher Education, 45(3), 622-634. https://doi.org/10.1080/03075079.2018.1564902
Akar-Vural, R., Yılmaz-Özelçi, S., Çengel, M., & Gömleksiz, M. (2013). The development of the “Sense of Belonging to School” Scale. Egitim Arastirmalari Eurasian. Journal of Educational Research, 53, 215-230. https://doi.org/10.14689/EJER.2013.53.12
American Educational Research Association, American Psychological Association, & National Council on Measurement in Education. (2018). Standards for Educational and Psychological Testing. American Educational Research Association.
Aramendiz, M. F., & Delgadillo, N. (2021). Factores Asociados al Sentido de Pertenencia y su Relación con el Rendimiento Académico de los Estudiantes del Programa de Psicología de la Universidad Nacional Abierta y a Distancia-UNAD, CEAD Ibagué. (Degree Thesis, Universidad Nacional Abierta y a Distancia). Repositorio Institucional UNAD. https://repository.unad.edu.co/handle/10596/40219
Ato, M., López-García, J. J., & Benavente, A. (2013). Un sistema de clasificación de los diseños de investigación en psicología. Anales de Psicología, 29(3), 1038–1059. https://doi.org/10.6018/analesps.29.3.178511
Bentler, P., & Bonett, D. (1980). Significance tests and goodness of fit in the analysis of covariance structures. Psychological Bulletin, 88(3), 588-606. https://doi.org/10.1037//0033-2909.88.3.588
Byrne, B. (2008). Testing for multigroup equivalence of a measuring instrument: A walk through the process. Psicothema, 20(4), 872-882.
Chavis, D., Lee, K., & Acosta J. (2008, June). The Sense of Community (SCI) Revised: the reliability and validity of the SCI-II (Paper presentation). 2nd International Community Psychology Conference, Lisboa, Portugal.
Checa, I., & Oberst, U. (2022). Measuring belongingness: Validation and invariance of the general belongingness scale in Spanish adults. Current Psychology, 41(1), 8490-8498. https://doi.org/10.1007/s12144-020-01279-x
Corona, A. (2020). El sentido de pertenencia, una estrategia de mejora en el proceso formativo en las artes. Estudio de caso en Danza en una universidad mexicana. Páginas de Educación, 13(2), 59-79. https://doi.org/10.22235/pe.v13i2.2172
Costello, A. B., & Osborne, J. (2005). Best practices in exploratory factor analysis: four recommendations for getting the most from your analysis. Practical Assessment Research & Evaluation, 10(7), 1-9.
Dávila de León, C., & Jiménez, G. (2014). Sentido de pertenencia y compromiso organizacional: predicción del bienestar. Revista de Psicología (PUCP), 32(2), 271-302. https://doi.org/10.18800/psico.201402.004
De Besa-Gutiérrez, M. R., Gil-Flores, J., & García-González, A. J. (2019). Variables psicosociales y rendimiento académico asociados al optimismo en estudiantes universitarios españoles de nuevo ingreso. Acta Colombiana de Psicología, 22(1), 152-163. https://doi.org/10.14718/ACP.2019.22.1.8
Drezner, N. D., & Pizmony-Levy, O. (2021). I belong, therefore, I give? The impact of sense of belonging on graduate student alumni engagement. Nonprofit and Voluntary Sector Quarterly, 50(4), 753-777. https://doi.org/10.1177/0899764020977687
Elosua, P. (2021). Aplicación remota de test: riesgos y recomendaciones. Papeles del Psicólogo, 42(1), 33-37. https://doi.org/10.23923/pap.psicol2021.2952
Fornell, C., & Larcker, D. F. (1981). Evaluating structural equation models with unobservable variables and measurement error. Journal of Marketing Research, 18(1), 39-50. https://doi.org/10.2307/3151312
Frías-Navarro, D. (2022). Apuntes de estimación de la fiabilidad de consistencia interna de los ítems de un instrumento de medida. Universidad de Valencia. https://www.uv.es/friasnav/AlfaCronbach.pdf
Gillen-O’Neel, C. (2021). Sense of belonging and student engagement: A daily study of first- and continuing-generation college students. Reserah in Higher Education, 62, 45-71. https://doi.org/10.1007/s11162-019-09570-y
Gopalan, M., & Brady, S. T. (2020). College students’ sense of belonging: A national perspective. Educational Researcher, 49(2), 134-137. https://doi.org/10.3102/0013189X19897622
Graham, C. W. & Moir, Z. (2022). Belonging to the university or being in the world: From belonging to relational being. Journal of University Teaching & Learning Practice, 19(4), Article 04. https://ro.uow.edu.au/jutlp/vol19/iss4/04
Gravett, K., & Ajjawi, R. (2022). Belonging as situated practice. Studies in Higher Education, 47(7), 1386-1396. https://doi.org/10.1080/03075079.2021.1894118
Hagerty, B. M., Williams, R. A., Coyne, J. C., & Early, M. R. (1996). Sense of belonging and indicators of social and psychological functioning. Archives of Psychiatric Nursing, 10(4), 235-244. https://doi.org/10.1016/S0883-9417(96)80029-X
Haim-Litevsky, D., Komemi, R., & Lipskaya-Velikovsky, L. (2023). Sense of Belonging, Meaningful Daily Life Participation, and Well-Being: Integrated Investigation. International Journal of Environmental Research and Public Health, 20(5), 4121. https://doi.org/10.3390/ijerph20054121
Hausmann, L. R. M., Schofield, J. W., & Woods, R. L. (2007). Sense of belonging as a predictor of intentions to persist among African American and White first-year college students. Research in Higher Education, 48(1), 803-839. https://doi.org/10.1007/s11162-007-9052-9
Hausmann, L. R. M., Ye, F., Schofield, J. W., & Woods, R. (2009). Sense of belonging and persistence in White and African American first-year students. Research in Higher Education, 48(1), 649-669. https://doi.org/10.1007/s11162-009-9137-8
Hu, L., & Bentler, P. (1999). Cutoff criteria for fit indexes in covariance structure analysis: Conventional criteria versus new alternatives. Structural Equation Modeling: A Multidisciplinary Journal, 6(1), 1-55. https://doi.org/10.1080/10705519909540118
International Test Commission. (2017). The ITC Guidelines for Translating and Adapting Tests (2nd ed.). www.InTestCom.org
Johnson, J. A. (2005). Ascertaining the validity of individual protocols from Web-based personality inventories. Journal of Research in Personality, 39(1), 103-129. https://doi.org/10.1016/j.jrp.2004.09.009
Katz, M. H. (2006). Multivariable analysis (2nd ed.). Cambridge University Press.
Kuang, X., Mok, M. M. C., Chiu, M. M., & Zhu, J. (2019). Sense of school belonging: Psychometric properties and differences across gender, grades, and East Asian societies. PsyCh Journal, 8(4), 449-464. https://doi.org/10.1002/pchj.275
Krippendorff, K. (2011). Computing Krippendorff’s Alpha-Reliability. Annenberg School for Communication Departmental Papers. https://www.asc.upenn.edu/sites/default/files/2021-03/Computing%20Krippendorff%27s%20Alpha-Reliability.pdf
Lambert, N. M., Stillman, T. F., Hicks, J. A., Kamble, S., Baumeister, R. F., & Fincham, F. D. (2013). To belong is to matter: sense of belonging enhances meaning in life. Personality and Social Psychology Bulletin, 39(11), 1418-1427. https://doi.org/10.1177/0146167213499186
Lawshe, C. H. (1975). A quantitative approach to content validity. Personnel Psychology, 28, 563-575. https://doi.org/10.1111/j.1744-6570.1975.tb01393.x
Leary, M., Kelly, K., Cottrell, C., & Schreindorfer, L. (2013). Construct validity of the Need to Belong Scale: mapping the nomological network. Journal of Personality Assessment, 95(6), 610-624. https://doi.org/10.1080/00223891.2013.819511
Lloret-Segura, S., Ferreres-Traver, A., Hernández-Baeza, A., & Tomás-Marco, I. (2014). El análisis factorial exploratorio de los ítems: una guía práctica, revisada y actualizada. Anales de Psicología, 30(3), 1151-1169. https://doi.org/10.6018/analesps.30.3.199361
Malone, G., Pillow, D., & Osman, A. (2012). The General Belongingness Scale (GBS): Assessing achieved belongingness. Personality and Individual Differences, 52(3), 311-316. https://doi.org/10.1016/j.paid.2011.10.027
Maluenda-Albornoz, J., Bernardo, A. B., Díaz-Mujica, A., & Chacano-Osses, D. (2022a). Adaptación y evaluación psicométrica de la escala de Identificación Organizacional con Centros Educativos en estudiantado de ingeniería chileno. Cuaderno De Pedagogía Universitaria, 19(37), 144-156. https://doi.org/10.29197/cpu.v19i37.455
Maluenda-Albornoz, J., Bazignan, C., & Rojas, X. (2022b). Belonging to Engineering During the First Year in Online Education. 41st International Conference of the Chilean Computer Science Society (SCCC), 1-6. https://doi.org/10.1109/SCCC57464.2022.10000341
Maluenda-Albornoz, J., Berríos-Riquelme, J., Infante-Villagrán, V., & Lobos-Peña, K. (2023). Perceived Social Support and Engagement in First-Year Students: The Mediating Role of Belonging during COVID-19. Sustainability, 15(1), 1-10 https://doi.org/10.3390/su15010597
Mellor, D., Stokes, M., Firth, L., Hayashi, Y., & Cummins, R. (2008). Need for belonging, relationship satisfaction, loneliness, and life satisfaction. Personality and Individual Differences, 45(3), 213-218. https://doi.org/10.1016/j.paid.2008.03.020
Medrano, L. A., & Muñoz-Navarro, R. (2017). Aproximación conceptual y práctica a los modelos de ecuaciones estructurales. Revista Digital de Investigación en Docencia Universitaria, 11(1), 219-239. https://doi.org/10.19083/ridu.11.486
Muñiz, J., Elosua, P., & Hambleton, R. (2013). Directrices para la traducción y adaptación de los tests: segunda edición. Psicothema, 25(2), 151-157. https://doi.org/10.7334/psicothema2013.24
Novo, M., Redondo, L., Seijo, D., & Arce, R. (2016). Diseño y validación de una escala para la evaluación del sentido de comunidad en grupos académicos virtuales. Revista de Investigación en Educación, 14(2), 126-140.
Ostrove, J. M., & Long, S. (2007). Social Class and Belonging: Implications for College Adjustment. The Review of Higher Education, 30(4), 363-389. https://doi.org/10.1353/rhe.2007.0028
Pastor, Y., García-Jiménez, A., Pérez-Torres, V., López de Ayala, M., & Catalina-García, B. (2022). The Need to Belong Scale Revisited: Spanish validation, wording effect in its measurement, and its relationship with social networks use in adolescence. TMP - Testing, Psychometric, Methodology in Applied Psychology, 29(2), 241-255. https://doi.org/10.4473/TPM29.2.6
Patel, S., Shrisman, M., & Bennett, K. (2023). Development and psychometric testing of the Sense of Belonging in Nursing School (SBNS) Scale. Journal of Nursing Measurament, 31(1), 19-29. https://doi.org/10.1891/JNM-2021-0005
Pedler, M. L., Willis, R., & Nieuwoudt, J. E. (2022). A sense of belonging at university: student retention, motivation and enjoyment. Journal of Further and Higher Education, 46(3), 397-408. https://doi.org/10.1080/0309877X.2021.1955844
Pérez, E., & Medrano, L. (2010). Análisis factorial exploratorio. Bases conceptuales y metodológicas. Revista Argentina de Ciencias del Comportamiento, 2(1), 58-66.
Putnick, D. L., & Bornstein, M. H. (2016). Measurement invariance conventions and reporting: The state of the art and future directions for psychological research. Developmental Review, 41, 71-90. https://doi.org/10.1016/j.dr.2016.06.004s
Rojas-Andrade, R. M., Cabello, P., Leiva, L., & Castillo, N. (2019). Psychometric adaptation of the sense of community index (SCI-II) in Chilean public schools. Acta Colombiana De Psicología, 22(1), 273-284. https://doi.org/10.14718/ACP.2019.22.1.13
Roque, Y., & Quizhpi, L. R. (2022). Sentido de pertenencia en estudiantes universitarios ecuatorianos en tiempos de pandemia. Puriq, 4, e272. https://doi.org/10.37073/puriq.4.272
Rosseel, Y. (2012). lavaan: An R Package for Structural Equation Modeling. Journal of Statistical Software, 48(2), 1-36. https://doi.org/10.18637/jss.v048.i02
Satorra, A., & Bentler, P. M. (1994). Corrections to test statistics and standard errors in covariance structure analysis. In A. von Eye & C. C. Clogg (Eds.), Latent variables analysis: Applications for developmental research (pp. 399-419). Sage.
Suárez-Álvarez, J., Pedrosa, I., Lozano, L. M., García-Cueto, E., Cuesta, M., & Muñiz, J. (2018). El uso de ítems inversos en las escalas tipo Likert: una práctica cuestionable. Psicothema, 30(2),149-158.
Slaten, C. D., Elison, Z. M., Deemer, E. D., Hughes, H. A., & Shemwell, D. A. (2018). The development and validation of the university belonging questionnaire. The Journal of Experimental Education, 86(4), 633-651. https://doi.org/10.1080/00220973.2017.1339009
Slaton, C. R., Lammers, W., & Park, A. (2023). How school belongingness in diverse students moderates student perceptions of teachers’ cultural humility in predicting student–teacher working alliance. Psychology in the Schools, 60, 2360-2372. https://doi.org/10.1002/pits.22862
Strayhorn, T. L. (2012). College students’ sense of belonging: A key to educational success for all students. Routledge.
Strayhorn, T. L. (2018). College students’ sense of belonging: A key to educational success for all students (2nd ed.). Routledge.
Svetina, D., Rutkowski, L., & Rutkowski, D. (2020). Multiple-group invariance with categorical outcomes using updated guidelines: An illustration using Mplus and the lavaan/semTools packages. Structural Equation Modeling, 27(1), 111-130. https://doi.org/10.1080/10705511.2019.1602776
Tomás, J. M., Sancho Requena, P., Oliver Germes, A., Galiana Llinares, L., & Meléndez Moral, J. C. (2012). Efectos de método asociados a ítems invertidos vs. ítems en negativo. Revista Mexicana de Psicología, 29(2), 105-115.
Tristan, A. (2008). Modificación al modelo de Lawshe para el dictamen de validez de contenido de un instrumento objetivo. Avances en Medición, 6(1), 37-48.
Vaccaro, A., & Newman, B. M. (2017). A sense of belonging through the eyes of first-year LGBPQ students. Journal of Student Affairs Research and Practice, 54(2), 137-149. https://doi.org/10.1080/19496591.2016.1211533
Ventura-León, J. (2017). Intervalos de confianza para coeficiente Omega: Propuesta para el cálculo. Adicciones, 30(1), 77-78. https://doi.org/10.20882/adicciones.962
Verdam, M. G., Oort, F. J., & Sprangers, M. A. (2016). Using structural equation modeling to detect response shifts and true change in discrete variables: an application to the items of the SF-36. Quality of Life Research, 25(6), 1361-1383. https://doi.org/10.1007/s11136-015-1195-0
Walton, G. M., & Cohen, G. L. (2007). A question of belonging: Race, social fit, and achievement. Journal of Personality and Social Psychology, 92(1), 82-96. https://doi.org/10.1037/0022-3514.92.1.82
Williams, B., Onsman, A., & Brown, T. (2010). Exploratory factor analysis: A five-step guide for novices. Journal of Emergency Primary Health Care, 8(3), 1-13. https://doi.org/10.33151/ajp.8.3.93
Xu, L., Duan, P., Ma, L., & Dou, S. (2023). Professional identity and self-regulated learning: the mediating role of intrinsic motivation and the moderating role of sense of school belonging. SAGE open, 13(2). https://doi.org/10.1177/21582440231177034
Yáñez, R., Pérez, M. V., & Ahumada, L. (2006). Adaptación y validación de una escala de identificación organizacional con centros de estudio. Paideia, 41(1), 65-76.
Yeager, D. S., Walton, G. M., Brady, S. T., Akcinar, E. N., Paunesku, D., Keane, L., Kamentz, D., Ritter, G., Duckworth, A. L., Urstein, R., Gomez, E. M., Markus, H. R., Cohen, G. L., & Dweck, C. S. (2016). Teaching a lay theory before college narrows achievement gaps at scale. Proceedings of the National Academy of Sciences, 113, E3341–E3348. https://doi.org/10.1073/pnas.1524360113
Data availability: The dataset supporting the results of this study is not available.
How to cite: Correa-Rojas, J., Grimaldo, M., Valdivia Vizarreta, P., & Del Águila-Chávez, M. (2024). Adaptation and Analysis of the Internal Structure of the Sense of Belonging at University Scale (SBUS) in Peruvian Students. Ciencias Psicológicas, 18(1), e-3498. https://doi.org/10.22235/cp.v18i1.3498
Authors’ contribution (CRediT Taxonomy): 1. Conceptualization; 2. Data curation; 3. Formal Analysis; 4. Funding acquisition; 5. Investigation; 6. Methodology; 7. Project administration; 8. Resources; 9. Software; 10. Supervision; 11. Validation; 12. Visualization; 13. Writing: original draft; 14. Writing: review & editing.
J. C.-R. has contributed in 1, 2, 4, 5, 6, 11, 12, 13; M. G. in 1, 3, 5, 7, 9, 10, 13; P. V. V. in 3, 5, 10, 13, 14; M. del A.-C. in 5, 8, 10, 13, 14.
Scientific editor in-charge: Dr. Cecilia Cracco.