Ciencias Psicológicas v16n2
julio-diciembre 2025
10.22235/cp.v16i2.2723
Artículos Originales
Construcción y validación de una Escala de Resiliencia Comunitaria Frente a Amenazas Naturales
Construction and validation of a Scale of Community Resilience Facing Natural Hazards
Construção e validação de uma escala de resiliência comunitária ameaças naturais
Verónica Suárez Ramos1, ORCID 0000-0002-7932-5726
Esperanza López Vázquez2, ORCID 0000-0002-0401-8414
César Merino Soto3, ORCID 0000-0002-1407-8306
1 Universidad Autónoma del Estado de Morelos, Centro de Investigación Transdisciplinar en Psicología, México, [email protected]
2 Universidad Autónoma del Estado de Morelos, Centro de Investigación Transdisciplinar en Psicología, México
3 Universidad Autónoma del Estado de Morelos, Centro de Investigación Transdisciplinar en Psicología, México
Resumen:
Antecedentes: Los efectos ocasionados por los fenómenos de origen natural han ido en aumento, agravando la vulnerabilidad de las poblaciones expuestas. Resulta necesario medir la capacidad de resiliencia de la comunidad para hacer frente a este tipo de situaciones adversas. El objetivo del estudio fue la construcción y validación de una escala de autoinforme de resiliencia comunitaria. Método: Los ítems se basaron en la propuesta de Twigg (2007) y Suárez-Ojeda (2001). Para la validación del instrumento se empleó la V de Aiken y el análisis semi-confirmatorio (McDonald, 2005). Se contó con una muestra de 290 participantes con un rango de edad de 18 a 78 años, de los municipios de Jojutla y Yautepec del Estado de Morelos (México). Resultados: Se obtuvo una escala final unidimensional conformada por 16 ítems, consistencia interna Ω = .924. Conclusiones: Esta escala puede ser de utilidad para quienes trabajan en la gestión integral de riesgos de desastres.
Palabras clave: validación de instrumentos; construcción de instrumentos; resiliencia comunitaria; gestión de riesgo; amenazas naturales.
Abstract:
Background: The effects caused by natural phenomena have been increasing, aggravating the vulnerability of exposed populations. It is necessary to measure the resilience capacity of the community to face this type of adverse situations. The objective of the study was the construction and validation of a self-report scale of community resilience. Method: The items were based on the proposal of Twigg (2007) and Suárez-Ojeda (2001). The AIKEN V and semi-confirmatory analysis (McDonald, 2005) were used to validate the instrument. There was a sample of 290 participants with an age range of 18 to 78 years, from the municipalities of Jojutla and Yautepec in the State of Morelos (Mexico). Results: A final unidimensional scale made up of 16 items was obtained, internal consistency Ω = .924. Conclusions: This scale can be useful for those working in integrated disaster risk management.
Keywords: instrument validation; instrument construction; community resilience; risk management; natural hazards.
Resumo:
Antecedentes: Os efeitos causados por fenômenos naturais vêm aumentando, agravando a vulnerabilidade das populações expostas. É necessário mensurar a capacidade de resiliência da comunidade para lidar com esse tipo de situação adversa. O objetivo do estudo foi a construção e a validação de uma escala de autorrelato de resiliência comunitária. Método: Os itens foram baseados na proposta de Twigg (2007) e Suárez-Ojeda (2001). Para validação do instrumento, utilizou-se o V do AIKEN e a análise semiconfirmatória (McDonald, 2005). A amostra foi de 290 participantes, com faixa etária de 18 a 78 anos, dos municípios de Jojutla e Yautepec do Estado de Morelos (México). Resultados: Obteve-se uma escala final unidimensional composta por 16 itens, consistência interna Ω = 0,924. Conclusões: Esta escala pode ser útil para quem trabalha na gestão integral do risco de desastres.
Palavras-chave: validação de instrumento; construção de instrumentos; resiliência comunitária; gerenciamento de riscos; ameaças naturais.
Recibido: 24/10/2021
Aceptado: 26/05/2022
A nivel mundial los efectos ocasionados por fenómenos de origen hidrometeorológicos y geológicos ocurridos en el siglo XX y XXI han dejado pérdidas económicas por trillones de dólares; en el aspecto social por 4.03 billones en bienes y se reportaron 1.23 millones de personas fallecidas, así como afectaciones ambientales (United Nations Office for Disaster Risk Reduction (UNDRR), 2020). La Organización de la Naciones Unidas (ONU) ha hecho énfasis en su estrategia para la reducción de riesgo de desastres, la urgencia de promover la preparación, prevención, mitigación, respuesta, recuperación, rehabilitación, la reconstrucción frente a una crisis o desastre y particularmente la resiliencia comunitaria (Diario Oficial de la Federación, 2014; UNDRR, 2007).
La resiliencia puede entenderse como la capacidad humana para hacer frente, superar y salir fortalecido e incluso ser transformado por las experiencias adversas (Grotberg, 2006). No es estática y se basa en una habilidad dinámica que se va adaptando a la situación la cual puede considerarse también como una respuesta adaptativa a una amenaza o riesgo (Singh & Kaur, 2018). Diferentes estudios se han enfocado principalmente en la resiliencia individual (Bonanno, 2008; Davydov et al., 2010; Luthar & Cicchetti, 2000), pero la resiliencia comunitaria ha empezado a tomar más espacio en el panorama científico. Se entiende por resiliencia comunitaria a la “la habilidad de las comunidades y hogares para anticiparse y adaptarse a los riesgos y de absorber, responder y recuperarse de los choques y tensiones de manera oportuna y eficaz” (Twigg, 2007, p. 6). También se puede entender como un proceso resiliente a partir de los conocimientos culturales, las capacidades sociales y las estrategias organizativas frente a una adversidad (López & Limón, 2017). Las características resilientes son conocidas como atributos o pilares de resiliencia dentro de los cuales, según Suárez-Ojeda (2001), se encuentran la autoestima colectiva, identidad cultural, humor social, honestidad estatal y solidaridad. Otros aspectos que influyen en la resiliencia comunitaria son los índices de bienestar, los aspectos políticos, sociales, económicos, físicos (Almutairi et al., 2020) y culturales (De la Yncera, 2019; Lorenzo, 2016).
Contexto poblacional
Este instrumento se validó en el estado de Morelos, en las comunidades de Jojutla y Yautepec, que se encuentran expuestas a fenómenos naturales de origen hidrometeorológicos y geológicos. Los sismos son eventos que ocurren frecuentemente en el territorio mexicano; sin embargo, no ocurren con la misma frecuencia en el estado de Morelos. El sismo ocurrido el 19 de septiembre de 2017 afectó a varios municipios de dicho estado, entre los cuales se encontraban Jojutla, con dos mil casas afectas y 55 personas fallecidas. En Yautepec se reportaron 870 casas dañadas, sin pérdidas de vidas (Diario Oficial de la Federación, 2017). Ambos municipios cuentan con un alto índice de desarrollo humano dentro del estado, lo que permitió que se compararan las poblaciones.
Medición de la resiliencia comunitaria
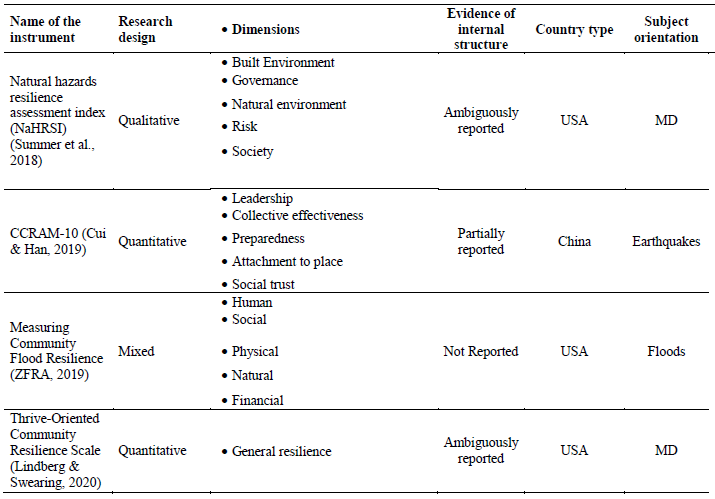
Se llevó a cabo una revisión sistemática rápida (Haby et al., 2016), con las palabras clave de community resilience scale, escalas de resiliencia comunitaria, en los siguientes motores de búsqueda: Google Scholar, ELSEVIER, para saber si había un instrumento que se pudiera adaptar al estudio de la resiliencia comunitaria ante situaciones de riesgo de fenómenos de origen natural en población mexicana. Los resultados se muestran en la tabla 1.
Tabla 1: Aspectos generalizables de índices, herramientas y escalas que miden la resiliencia comunitaria
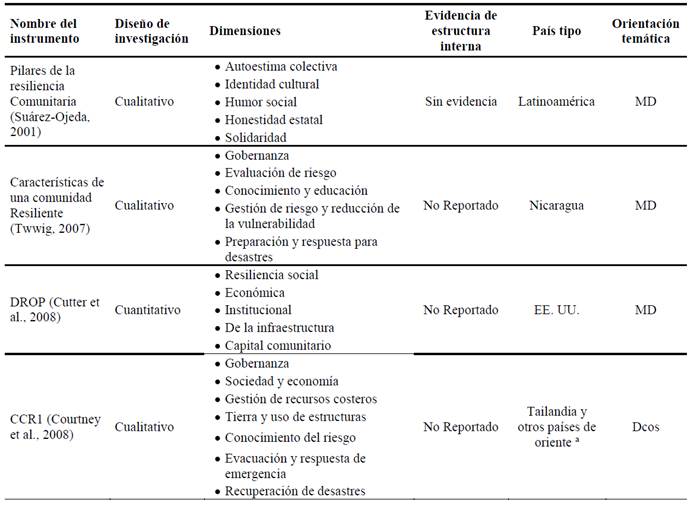
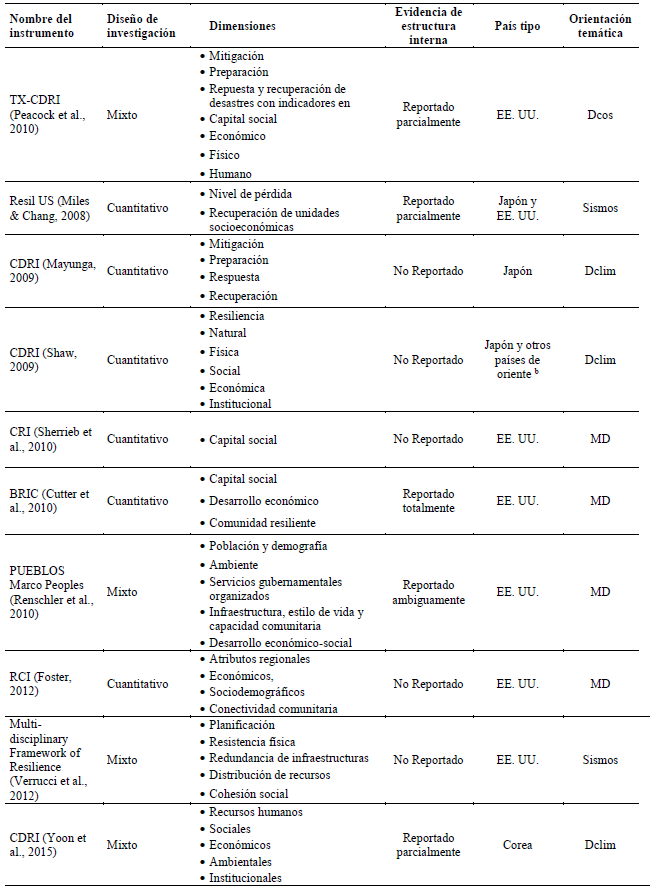
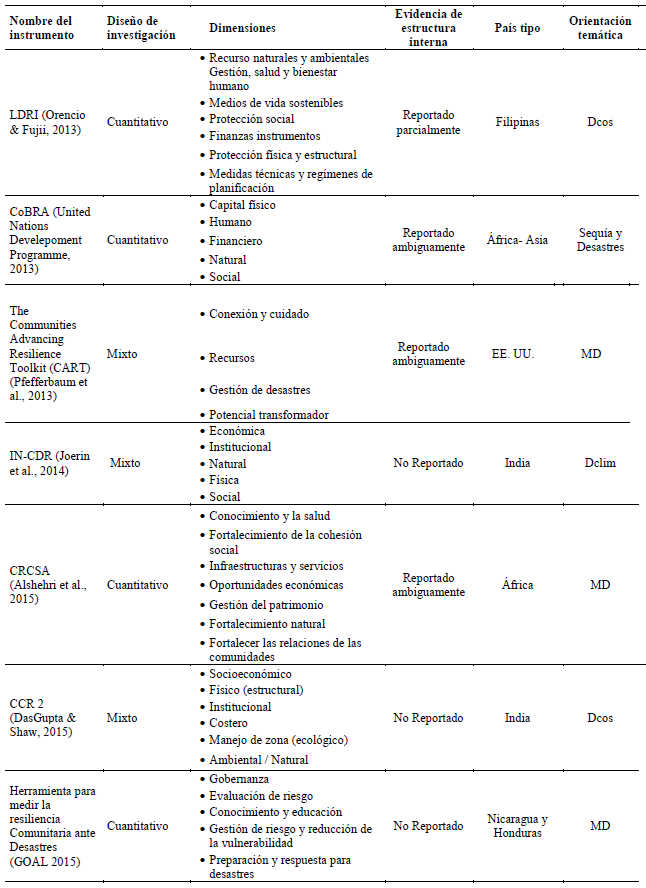
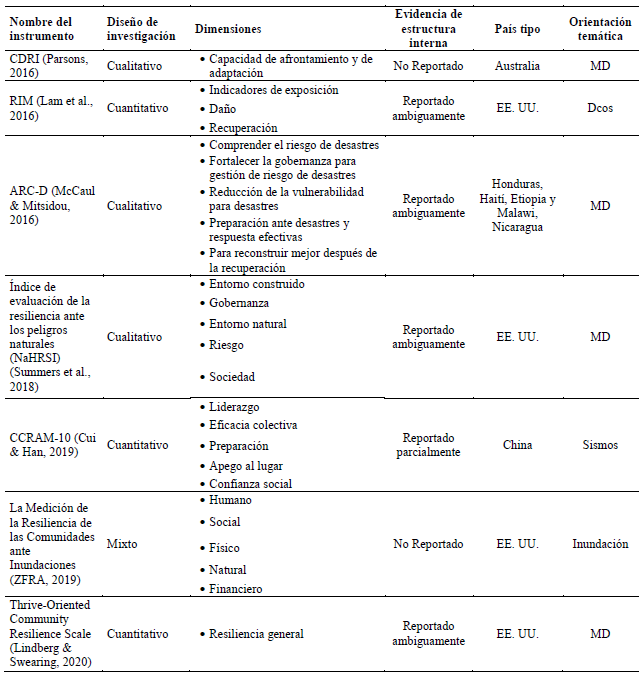
Notas. MD: multidesastres. DC: desastres costeros; DClim: desastres climáticos. a Sri Lanka, Indonesia, India y Maldivas. b Filipinas, Vietnam, India, Indonesia, Tailandia, Sri Lanka.
Después de un análisis profundo de cada una de las propuestas revisadas sobre los índices y herramientas existentes, se observó un vacío en los instrumentos que permitieran incorporar en la resiliencia comunitaria los aspectos de riesgo de amenazas naturales y la participación tanto de las instancias gubernamentales como de los recursos comunitarios existentes. En base a ello, se consideró que la propuesta teórica de Twigg (2007) daba las bases para la construcción de un instrumento abarcativo de los aspectos de resiliencia comunitaria en situaciones de riesgo de desastre, que podía además ser completada con la propuesta de Suárez-Ojeda (2001), que incluye dimensiones de apoyo social, solidaridad y humor social. Además, ambos autores realizaron trabajos de resiliencia en población Centroamérica, que comparte características con la población mexicana, como la economía y antecedentes con desastres de origen natural.
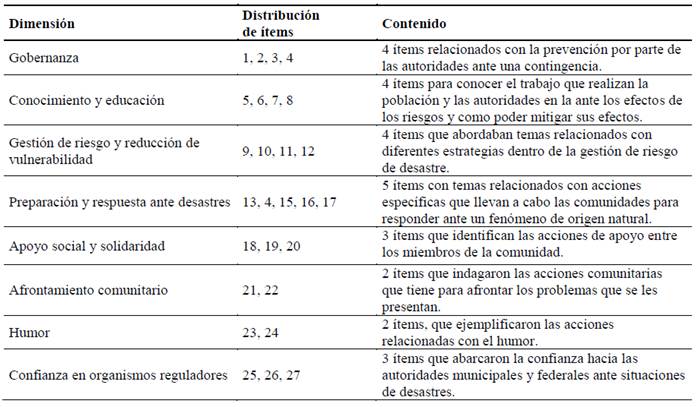
A partir de la revisión teórica de Twigg (2007) y Suárez-Ojeda (2001) se eligieron las definiciones conceptuales de las dimensiones, siendo las siguientes: a) Gobernanza: concerniente a las políticas públicas encargadas de la planeación, regulación e integración de los sistemas institucionales, las alianzas entre diversos organismos de la sociedad civil y la participación de las comunidades; b) Conocimiento y educación: identifica la información que tiene la población en relación con la amenaza-riesgo, vulnerabilidad e impacto, así como las capacidades científicas y técnicas para hacerles frente; c) Gestión de riesgo y reducción de vulnerabilidad: gestión del medio ambiente y recursos naturales, salud y bienestar de las comunidades, seguridad social mediante instrumentos financieros, protección física y medidas técnicas y estructurales, así como la implementación de sistemas de planeación que buscan la reducción de la vulnerabilidad; d) Preparación y respuesta ante desastres: conocer la capacidad de organización para dar respuesta a un fenómeno natural, a través de sistemas de alerta temprana, preparación y planeación de la contingencia, habilitar los recursos e infraestructura para atender a las emergencias, así como establecer los protocolos de respuesta y recuperación de la emergencia contando con la partición del gobierno y sociedad civil; e) Apoyo social y solidaridad, es la capacidad de colaboración con otros que requieren apoyo para salir adelante, que son parte de la comunidad y tiene como fin la búsqueda del bien común; f) Afrontamiento comunitario, es la forma particular en que cada grupo afronta las situaciones adversas a las que se encuentra expuestas: g) Humor social, es la capacidad de reír a pesar de las cosas negativas, que estén ocurriendo en el entorno y buscando una solución optimista para salir de ello; h) Confianza en organismos reguladores, es el buen uso de los recursos existentes y gestionados para la comunidad por parte de las autoridades locales y federales para la gestión del riesgo.
Tomando en cuenta el vacío en las herramientas de medición sobre resiliencia comunitaria en situaciones de amenazas naturales, en el presente estudio se elaboró un instrumento inspirado en los aportes de dos autores. A continuación, se presentan las dimensiones teóricas elegidas y las evidencias de validez de contenido y de estructura interna.
Material y métodos
Participantes
La muestra convocada fue elegida de manera no probabilísticamente y conformada bajo el cumplimiento de los siguientes criterios de inclusión: a) haber vivido en algún momento de su vida los efectos de un desastre natural (sismo y/o inundación), b) ser mayor de edad, c) haber aprobado libremente su participación, d) ser adscrito y residente de estas comunidades. Los criterios de exclusión post-recolección de datos fueron: ítems sin responder (valores perdidos) y la identificación de valores extremos multivariados (outliers).
La muestra seleccionada, con base en un muestreo no probabilístico, fueron pobladores de Jojutla (n = 263; 91 %) y Yautepec (n = 27; 9 %) siendo un total de 290 participantes, 55.7 % mujeres y 44.3 % hombres con un rango de edad de 18 a 79 años (M = 29.4; DE = 14.5). Con relación al nivel educativo el 27.9 % contaba con nivel básico, 39.7 % con nivel medio superior, 30.2 % licenciatura, 0.7 % posgrado, y 1.4 %.sin estudios.
Instrumento
En la elaboración de las situaciones que promueven la resiliencia comunitaria nos apoyamos en los componentes teóricos propuestos por Twigg (2007) y Suárez-Ojeda (2001), considerándose las 8 dimensiones explicadas anteriormente.
Procedimiento
Dimensionalidad. El instrumento se representó con ocho dimensiones basadas en las 5 dimensiones teóricas propuestas por Twigg (2007) y las 3 propuestas por Suárez-Ojeda (2001), con expectativas correlacionadas. Las definiciones fueron elaboradas considerando su aplicabilidad conceptual al contexto de las comunidades mexicanas elegidas y su potencial de generalización a otros contextos latinoamericanos, su aproximada convergencia con otras definiciones de la literatura, su potencial para ser representada en el contenido de los ítems (Delgado-Rico et al., 2012).
Elaboración de ítems. Para realizar la escritura de los ítems se revisó la literatura existente, determinándose el modelo teórico y la definición operacional de las dimensiones que conformarían el instrumento. Posteriormente se realizó la escritura de los ítems, redactándose en primera persona, cuidando tener un lenguaje claro, homogéneo y acorde a las dimensiones propuestas.
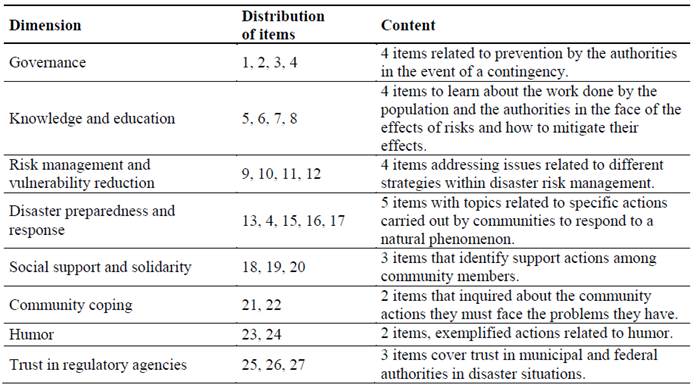
Como directriz de opciones de respuesta se propuso una escala Likert de 5 puntos que diera como posibles respuestas el grado de desacuerdo-acuerdo, con relación a los ítems elaborados. Se buscó una longitud homogénea en cuanto al contenido y apariencia, evitando que los ítems se sobrepusieran entre ellos (Martínez et al., 2009). Se propusieron inicialmente 27 ítems distribuidos en 8 dimensiones teóricas como aparece en la tabla 2.
Tabla 2: Operacionalización conceptual y distribución de ítems del instrumento
Jueces expertos. Una vez integrada la propuesta del instrumento, se empleó la técnica de juicio de expertos que permitió someter las preguntas al escrutinio de personas expertas en la materia, con la finalidad de determinar qué tan pertinentes eran las preguntas de la escala en relación con el tema propuesto (Escobar-Pérez & Cuervo-Martínez, 2008). El grupo de jueces estuvo conformado por cinco psicólogos elegidos considerando su experticia verificable mediante sus publicaciones y su experiencia de campo dentro de sus áreas de trabajo con relación al tema: dos académicos de tiempo completo en universidades de México y Chile, y tres psicólogos en desastres que han formado parte de la Cruz Roja Mexicana e Internacional y del programa de Atención Psicológica para Casos de Desastres (APSIDE). Cada uno fue contactado individualmente y les fue enviado un formulario explicando las instrucciones para evaluar el contenido de los ítems en los criterios de coherencia (definido como que el ítem tenga relación lógica con la dimensión o indicador que se está midiendo), relevancia (definido como que el ítem es esencial o importante, por lo que debe de ser incluido) y claridad (definido como que el ítem se comprende fácilmente, es decir cuenta con una adecuada sintaxis y semántica). Asimismo, se les pidió que realizaran observaciones y sugerencias de acuerdo a su consideración. Cada juez hizo sus aportes de manera independiente al resto de jueces. Las respuestas de los jueces fueron analizadas por medio del coeficiente V de Aiken (Aiken, 1985) para ver el grado de acuerdo entre los expertos en cuanto a claridad, relevancia y coherencia. Se utilizó el programa ICAiken (Merino-Soto & Livia, 2009).
Jueces participantes. Debido que pueden existir posibles discrepancias en la percepción sobre la pertinencia conceptual y claridad de los ítems percibidos por jueces y participantes (Merino-Soto, 2016, 2018). Se llevó a cabo una aplicación piloto a 33 personas de una de las comunidades a estudiar, con un rango de edad de 18 a 70 años (M = 34.94; DE = 17.97), de los cuales 60.6 % eran hombres y 39.4 % eran mujeres. Durante la aplicación, los jueces participantes realizaron observaciones al instrumento, en cuanto a palabras que para ellos tenían un significado diferente o que no quedaban claras y causaba confusión en sus respuestas.
Con respecto a las dimensiones propuestas, no lograban diferenciar la dimensión de apoyo comunitario y afrontamiento, consideraban que pertenecían a una misma. La dimensión humor, no les quedaba clara y no la consideraban como importante.
Limpieza de datos. Se inició con la limpieza de datos mediante dos procedimientos, la identificación de: a) el número de ítems sin responder en el instrumento, y b) valores extremos multivariados. El primero se hizo con el conteo simple de los ítems no respondidos; el segundo se hizo aplicando el estadístico D2 (Mahalanobis, 1936), que obtiene la distancia multivariada del dato desde la respuesta centroide de las variables. Se usó el programa norm (DeCarlo, 1997). Para los estadísticos descriptivos, y de normalidad univariada (prueba Cramér-von-Mises, CVM; Darling, 1957) y multivariada (prueba HZ; Henze & Zirkler, 1990), se utilizó el programa MVN (Korkmaz, et al., 2014).
Dimensionalidad. El análisis de la estructura interna del instrumento consistió en la combinación de enfoques exploratorios y confirmatorios para establecer la estructura del instrumento. El enfoque exploratorio se aplicó en la verificación del número de dimensiones latentes que subyace a los datos, y para identificar la existencia de posibles dimensiones redundantes. El número de dimensiones propuesto para el instrumento fueron seis, el cual sirvió como hipótesis de la dimensionalidad. Se utilizó un enfoque de consenso (Lüdecke et al., 2020) entre varios métodos de identificación de la dimensionalidad, mediante los programas nFactors (Raiche & Magis, 2020) y psych (Revelle, 2019), integrados en el programa parameters (Lüdecke et al., 2020). Este enfoque consiste en la máxima convergencia de 24 métodos respecto al número de probables dimensiones.
Estructura interna de los ítems. En el siguiente paso, se aplicó un análisis factorial semi-confirmatorio (McDonald, 2005). Aunque en la etapa exploratoria la unidimensionalidad fue sugerida como la estructura interna recomendada, el análisis factorial semi-confirmatorio se aplicó para observar la congruencia de los ítems con sus factores y el grado de complejidad factorial. Se utilizó el programa Factor 10.10 (Lorenzo-Seva & Ferrando, 2006), aplicado a las correlaciones policóricas entre los ítems. Para evaluar la congruencia entre los ítems con su relación esperada de los factores, se usó el coeficiente de congruencia (Burt, 1948); valores mayores a 0.90 indican buena congruencia (Lorenzo-Seva & Ten Berge, 2006) por lo que se procedió a revisar los ítems que cumplían con el índice de congruencia aceptándose 16 de estos y aunque la unidimensionalidad fue sugerida, en la escala final se contemplaron que por lo menos dos ítems de cada una de las dimensiones teóricas fueran incluidos.
Análisis de datos
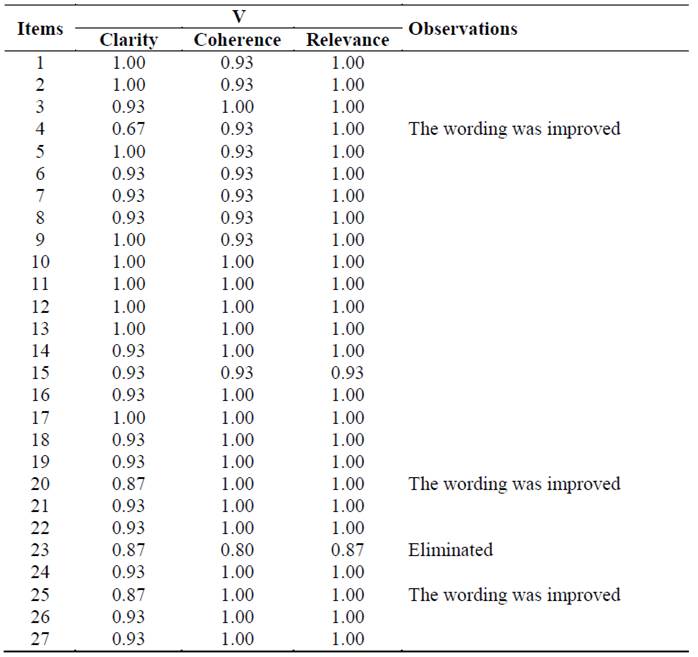
Jueces expertos. Todos los jueces expertos invitados a evaluar los ítems completaron la tarea. De los 27 ítems evaluados, solo uno se consideró que no contaba con validez de contenido suficiente (claridad. coherencia y relevancia < .87), por lo que se eliminó. A 3 ítems se realizaron mejoras en la redacción y se agregó 1 ítem. En la tabla 3 se muestran los resultados obtenidos con la V de Aiken en cuanto a claridad, coherencia y relevancia.
Tabla 3: Grado de acuerdo entre los jueces en relación con la claridad, coherencia y relevancia
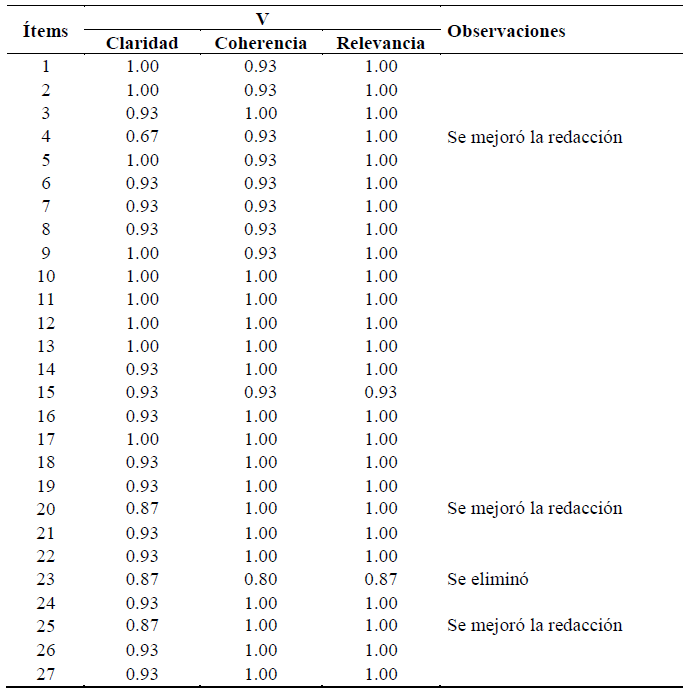
Nota. V: Coeficiente de Validez V de Aiken.
Jueces participantes. En relación a los jueces participantes, todos completaron la tarea. Reportado en relación a los ítems que la palabra “desaparecido” no la asociaban con el tema de los desastres de origen natural, sino la relacionaban a situaciones de violencia y del crimen organizado. Asimismo, las preguntas de las dimensiones del humor, afrontamiento comunitario, apoyo comunitario y solidaridad no las consideraban relevantes, les causaban confusión y mencionaban que eran parecidas.
Posteriormente, con las observaciones y sugerencias de los jueces, se decidió fusionar las dimensiones de afrontamiento comunitario y apoyo comunitario y solidaridad en una sola dimensión teórica ya que la redacción y contenido de éstas era muy parecido y su separación solo confundía al lector. Luego, se eliminaron las preguntas relacionadas al uso del humor como una manera de afrontar el peligro ya que fueron evaluadas como irrelevantes. Por sugerencia de los jueces se agregaron cuatro ítems más en las dimensiones de conocimiento y preparación respuesta, por lo que la escala para su validación estuvo conformada por 24 ítems.
Análisis preliminar. Se detectaron 3 casos (1 %) sin respuesta en los ítems, 2 (6 %) fueron imputados por valor modal del ítem. Respecto a los valores extremos multivariados, mediante la distancia Mahalanobis se detectaron y eliminaron 10 participantes que representan el 3.3 % de la muestra.
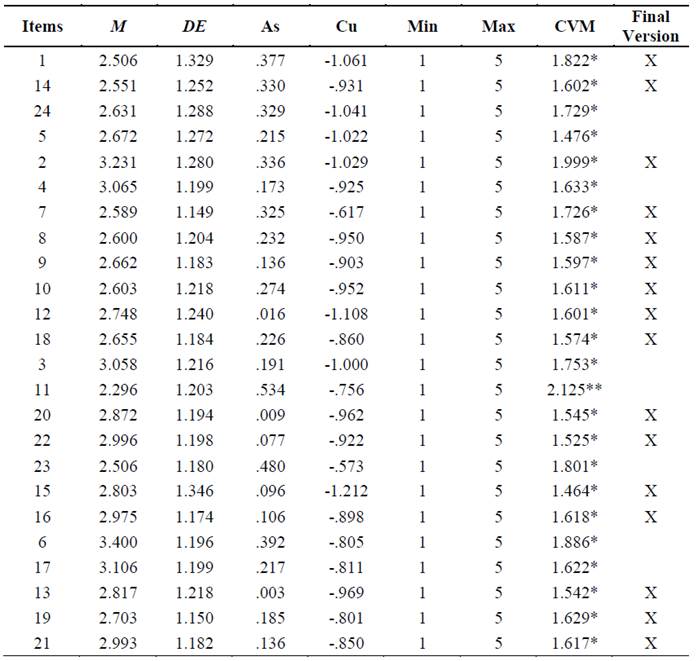
Análisis descriptivos de ítems. Se presentan los resultados descriptivos de los ítems. El conjunto de ítems no mostró normalidad multivariada (prueba Henze-Zirkler = 1.211; p < .01); esto fue derivado de la ausencia de normalidad univariada en cada ítem (prueba Cramer-von Mises, CVM < .01). Por otro lado, no parece existir restricción en el rango de respuesta, debido que los participantes utilizaron todo el rango de opciones. Esta similaridad en la utilización del escalamiento fue también fue observada en la dispersión (desviación estándar) de cada ítem como se muestra en la tabla 4.
Tabla 4: Estadísticos descriptivos para los ítems del Escala de Resiliencia Comunitaria (n = 290)
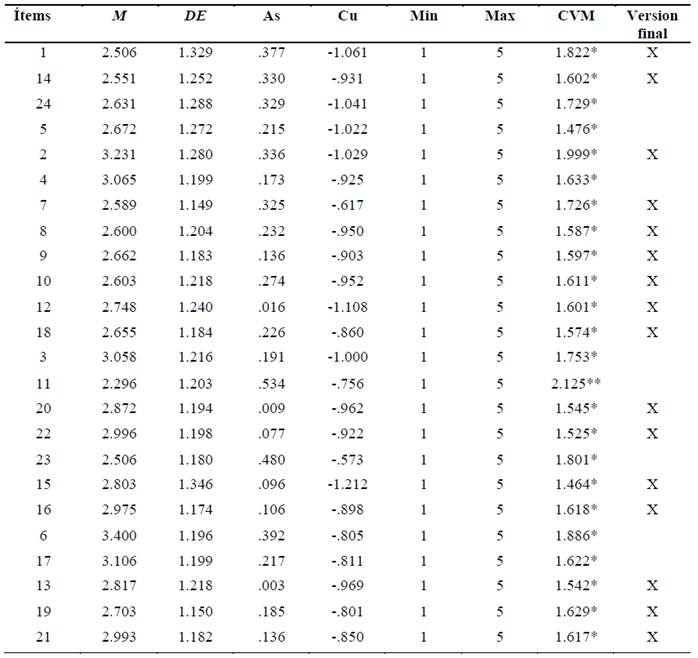
Nota. ERC: escala de resiliencia comunitaria; CVM: normalidad univariada Cramer von Mises; As: coeficiente de asimetría; Cu: coeficiente de curtosis.
*p < .05.
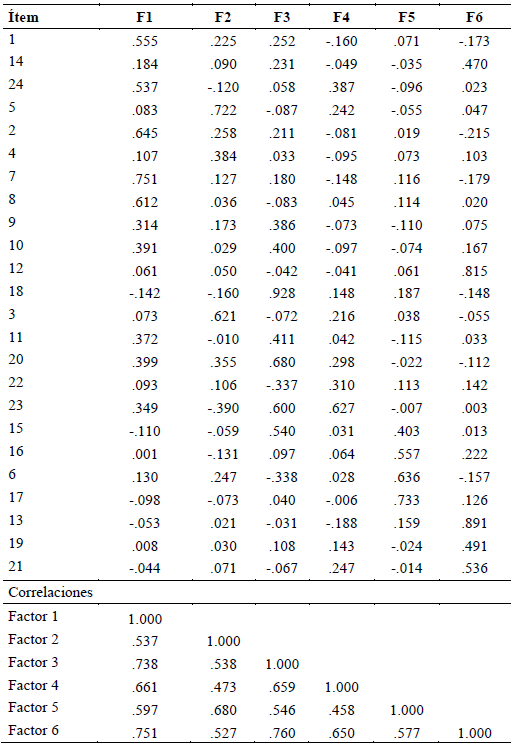
Dimensionalidad. Los autovalores empíricos obtenidos de la matriz de correlaciones inter-ítems fueron los siguientes (los 7 primeros): 10.379, 1.627, 1.105, 1.031, .988, .906, .797. Con la aplicación del enfoque de consenso se halló que una sola dimensión fue sugerida por el 21.7 % de métodos basados en el gráfico de la ladera o scree test (e.g., factor de aceleración y regresión múltiple), VSS (método 2), y ajuste de modelo (e.g., coeficientes TLI y RMSEA); dos factores (8.6 %) por VSS (método 1) y MAP-Velicer; tres factores (13.0 %) por CNG, BIC-información y BIC-ajuste; 4 factores (21.7 %) por métodos predominantemente basados en el gráfico de la ladera. Debido a la parsimonia en la representación de constructo del instrumento, la diferencia entre el primer autovalor comparado con el resto de los autovalores, y que los autovalores a partir del segundo fueron comparativamente muy pequeños respecto al primero, el aparente número de factores sugerido para el modelo de medición fue una sola dimensión.
Para examinar y verificar la aparente fuerte unidimensionalidad latente de los ítems del instrumento, en la tabla 5 se muestran las cargas factoriales de los 24 ítems. Hay ítems que cargan en más de un factor, y las correlaciones entre dimensiones, son consideradas altas, por lo que se decide realizar un análisis semiconfirmatorio.
Tabla 5: Cargas factoriales por ítem
En la tabla 6 se muestra el nivel de congruencia con la unidimensionalidad y las cargas factoriales, en donde se consideraron para ser parte del instrumento final, aquello que tuvieron un i- Único y I-ECV = o < .95 conformándose una escala unidimensional con 16 ítems que permitirá medir de manera general la Resiliencia Comunitaria en poblaciones del estado de Morelos que han estado expuestas a sismos e inundaciones.
Tabla 6: Nivel de congruencia de unidimensionalidad
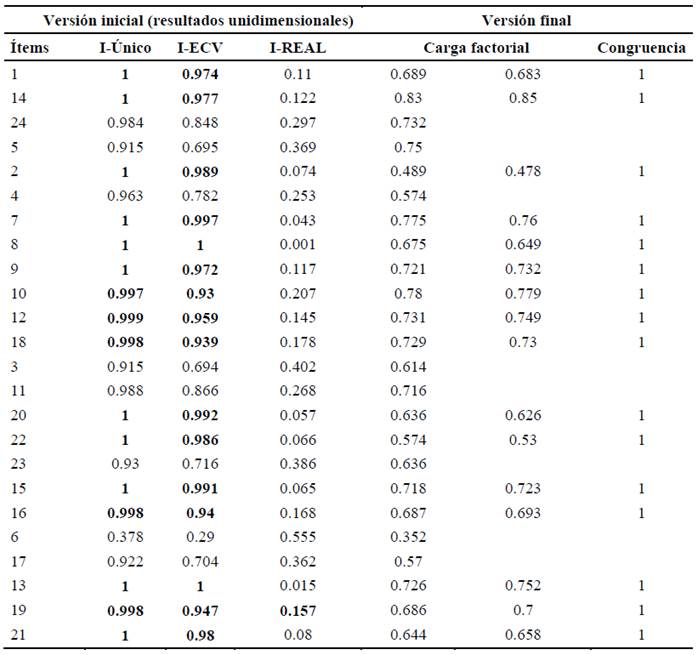
También, se observan en negritas los 16 ítems que conformaron el instrumento final, con cargas factoriales mayores entre .478 y .850 (M = .693; Md = .711). El coeficiente de confiabilidad Ω fue .924. Por lo que se considera que cumple con valores muy altos de confiabilidad y validez de estructura interna.
Discusión
En este estudio se presenta una escala de resiliencia comunitaria para población mexicana que permite medir de manera general las acciones como la prevención de riesgo, la preparación, la gobernanza, así como la confianza que se tiene en las autoridades frente a situaciones de riesgo de una manera global sin hacer una diferenciación entre las dimensiones propuestas inicialmente.
Las formas de abordar el análisis de la resiliencia comunitaria son complejas, porque implica el manejo de aspectos sociales que se entrelazan entre sí y que de manera práctica no siempre se logran diferenciar. También se tiene que considerar las problemáticas particulares que se quieran abordar. Un estudio reciente muestra la importancia de considerar, en el estudio de la resiliencia comunitaria, las problemáticas locales que atañen a una comunidad. De tal forma que se estructuran dimensiones en ese sentido (economía, infraestructura, gobernanza, instituciones, etc.); por ejemplo, en el caso las comunidades costeras, los temas que prevalecen son los sociales y económicos para evaluar la resiliencia comunitaria. Sin embargo, los marcos de referencia varían en función de lo que se busque en cada investigación, ya que las temáticas pueden ser muy amplias (Almutairi et al., 2020). Esto nos muestra la complejidad de establecer los parámetros que deben contener las dimensiones a medir cuando se habla de resiliencia comunitaria.
En un reciente estudio realizado en Norteamérica se propuso una escala de resiliencia frente a peligros naturales, trastornos económicos y otros desafíos, orientada a analizar el progreso de la resiliencia comunitaria percibida y evaluar la contribución de los predictores de la resiliencia. Sin embargo, los autores observan que las medidas de resiliencia comunitaria se combinan potencialmente con los predictores e indicadores de resiliencia, resultando una escala unidimensional que permite medir sobre la base de una resiliencia comunitaria general (Lindberg & Swearing, 2020). Podríamos pensar que una situación similar se presenta en nuestro caso ya que las diferentes dimensiones teóricas que se propusieron no lograron discriminar una diferencia entre ellas haciendo de nuestro instrumento una escala unidimensional de resiliencia comunitaria. A pesar de esta situación, nuestra escala cumple con todos los criterios de confiabilidad y validez por lo que ofrece una manera de medir este tipo de resiliencia frente a situaciones de amenazas naturales crónicas en población mexicana.
La escala podría validarse en otros países latinoamericanos ya que las dimensiones teóricas surgieron de temáticas propuestas en estudios realizados en América Latina. Otra particularidad de nuestra escala está también en el hecho de que está orientada a medir la resiliencia comunitaria desde los componentes de la gestión integral de riesgos en la que se involucran tanto acciones de la población como la de organismos reguladores, obteniendo un indicador global de resiliencia en este tema particular en población mexicana.
Conclusiones
Es importante señalar que el concepto de resiliencia comunitaria es un término que como su nombre lo indica, se va gestando dentro de la comunidad, considerando sus propias características intrínsecas como extrínsecas, por lo que es importante tener instrumentos que tomen en cuenta las diferencias culturales, sociales y geográficas de las poblaciones para poder promover las acciones de resiliencia acorde a las necesidades de la comunidad y a los riesgos expuestos. Dentro de las limitaciones de la escala está el hecho de que faltó validarse en una muestra más amplia. Esta propuesta puede ser de utilidad para quienes trabajan en la gestión integral de riesgos de desastres pues es importante considerar la visión de las poblaciones implicadas en los riesgos de origen natural.
Referencias:
Almutairi, A., Mourshed, M. & Mohammed, R. (2020). Coastal community resilience frameworks for disaster risk management. Natural Hazards: Journal of the International Society for the Prevention and Mitigation of Natural, 101(2), 595-630. https://doi.org/10.1007/s11069-020-03875-3
Alshehri, S., Rezgui, Y., & Li, H. (2015). Disaster community resilience assessment method: a consensus-based Delphi and AHP approach. Natural Hazards: Journal of the International Society for the Prevention and Mitigation of Natural, 78, 395-416. https://doi.org/10.1007/s11069-015-1719-5
Bonanno, G. (2008). Loss, Trauma, and Human Resilience: Have We Underestimated the Human Capacity to Thrive After Extremely Aversive Events? Psychological Trauma: Theory, Research, Practice, and Policy, 1, 101-113. https://doi.org/10.1037/0003-066X.59.1.20
Burt, C. (1948). The factorial study of temperament traits. British Journal of Psychology, Statistical Section, 1, 178-203. https://doi.org/10.1111/j.2044-8317.1948.tb00236.x
Courtney, C., Ahmed, A., Jackson, R., McKinnie, D., Rubinoff, P., Stein, A., Tighe, S., & White, A. (2008). Coastal Community Resilience in the Indian Ocean Region: Unifying framework, assessment and lessons learned. Solutions to Coastal Disasters 2008. https://doi.org/10.1061/40968(312)88
Cui, K. & Han, Z. (2019). Cross-Cultural Adaptation and Validation of the 10-Item Conjoint Community Resiliency Assessment Measurement in a Community-Based Sample in Southwest China. International Journal of Disaster Risk Science 10, 439-448. https://doi.org/10.1007/s13753-019-00240-2
Cutter, S., Barnes, L., Berry, M., Burton, C., Evans, E. & Tate, E. (2008). A place-based model for understanding community resilience to natural disasters. Global Environmental Change, 18, 598-606.
Cutter, S., Burton, C., & Emrich, T. (2010). Disaster resilience indicators for benchmarking baseline conditions. Journal of Homeland, Security and Emergency Management, 7, 1-22. http://dx.doi. org/10.2202/1547-7355.1732
Darling, D. (1957). The Kolmogorov-Smirnov, Cramer-von Mises Tests. Annals of Mathematic Statistic, 28(4), 823-838. https://doi.org/10.1214/aoms/1177706788
DasGupta, R. & Shaw, R. (2015). An indicator-based approach to assess coastal communities’ resilience against climate related disasters in Indian Sundarbans. Journal Coast Conservation 19, 85-101. http://dx.doi. org/10.1007/s11852-014-0369-1
Davydov, D., Stewart, R., Ritchie, K. & Chaudieu, I. (2010). Resilience and mental Health. Clinical Psychology Review, 30(5), pp. 479-495.
De la Yncera, N. de la C. (2019). Resiliencia comunitaria frente al riesgo de desastre de origen natural en Yautepec, Morelos (Disertación doctoral, Universidad Autónoma del Estado de Morelos). Repositorio Institucional de Acceso Abierto (RIAA) de la Universidad Autónoma del Estado de Morelos. http://riaa.uaem.mx/xmlui/handle/20.500.12055/792
DeCarlo, L. (1997). On the meaning and use of kurtosis. Psychological Methods, 2(3), 292-307. https://doi.org/10.1037/1082-989X.2.3.292
Delgado-Rico, E., Carretero-Dios, H., & Willbald, R. (2012). Content validity evidences in test development: An applied perspective. International Journal of Clinical and Health Psychology, 12(3), 449-459.
Diario Oficial de la Federación. (2014, 13 de mayo). Reglamento de la ley General de Protección Civil. https://www.dof.gob.mx/nota_detalle.php?codigo=5344324&fecha=13/05/2014
Diario Oficial de la Federación. (2017, 28 de septiembre). Declaratoria de Desastre Natural por la ocurrencia de sismo con magnitud 7.1 ocurrido el 19 de septiembre de 2017, en 33 municipios del estado de Morelos. http://www.dof.gob.mx/nota_detalle.php?codigo=5499058&fecha=28/09/2017
Escobar-Pérez, J. & Cuervo-Martínez, A. (2008). Validez de contenido y juicio de expertos: una aproximación a su utilización. Avances de Medición, 6, 27-36.
Foster, K. (2012). Resilience Capacity Index. Univ. California Berekley. http://bangportal.com/wp-content/uploads/2017/06/Resilience-Capacity-Index.pdf
GOAL. (2015). Herramienta para medir la resiliencia comunitaria ante desastres. Guía metodológica. https://dipecholac.net/docs/herramientas-proyecto-dipecho/honduras/Guia-Medicion-de-Resiliencia.pdf
Grotberg, E. (2006). ¿Qué entendemos por resiliencia? ¿Cómo promoverla? ¿Cómo utilizarla? En E. Grotberg (Ed.), La resiliencia en el mundo de hoy. Cómo superar las adversidades (pp. 17-57). Gedisa.
Haby, M., Chapman, E., Clark, R., Barreto, J., Reviez, L., & Lavis, J. (2016). What are the best methodologies for rapid reviews of the research evidence for evidence-informed decision making in health policy and practice: a rapid review. Health Research Policy and Systems, 14(83), 1-12. https://doi.org/10.1186/s12961-016-0155-7
Henze, N. & Zirkler, B. (1990). A class of invariant consistent tests for multivariate normality. Communications in Statistics – Theory and Methods, 19(10), 3595-3618. https://doi.org/10.1080/03610929008830400
Joerin, J., Shaw, R., Takeuchi, Y., & Krishnamurthy, R. (2014). The adoption of a Climate Disaster Resilience Index in Chennai, India. Desastres, 38, 540-561. https://doi.org/10.1111/disa.12058
Korkmaz, S., Goksuluk, D., & Zararsiz, G. (2014). MVN: An R package for assessing multivariate normality. The R Journal, 6(2), 151-162.
Lam, N., Reams, M., Li, K., Li, C., & Mata, L. (2016). Measuring Community Resilience to Coastal Hazards along the Northern Gulf of Mexico. Natural Hazards: Journal of the International Society for the Prevention and Mitigation of Natural, 17(1), 04015013. https://doi.org/10.1061/(ASCE)NH.1527-6996.0000193
Lindberg, K. & Swearing, T. (2020). A Reflective Thrive‐Oriented Community Resilience Scale. American Journal of Community Psychology, 65(3-4), 467-478. https://doi.org/10.1002/ajcp.12416
López, F. & Limón, F. (2017) Componentes del proceso de resiliencia comunitaria: conocimientos culturales, capacidades sociales y estrategias organizativas. PSIENCIA. Revista Latinoamericana de Ciencia Psicológica. 9(3), 1-13.
Lorenzo, A. (2016, 7-11 de noviembre). El entrenamiento histórico cultural como verdadero potenciador de la readaptación psicosocial para la promoción de salud y bienestar en el Caribe a comunidades damnificadas por desastres (Ponencia). Caribbean Regional Conference of Psychology 2016, Puerto Príncipe, Haití.
Lorenzo-Seva, U. & Ferrando, P. (2006). Factor 10.10. [Software gratuito]. Departamento de Psicología Universitat Rovira I Virgili. https://psico.fcep.urv.cat/utilitats/factor/Download.html
Lorenzo-Seva, U. & Ten Berge, J. (2006). Tucker's congruence coefficient as a meaningful index of factor similarity. Methodology, 2, 57-64. https://doi.org/10.1027/1614-2241.2.2.57
Lüdecke, D., Ben-Shachar, M. S., & Makowski, D. (2020). Describe and understand your model’s parameters. CRAN. https://easystats.github.io/parameters. 10.5281/zenodo.3731932
Luthar, S. & Cicchetti, D. (2000). The construct of resilience: implications for interventions and social policies. Development & Psychopathology, 12(4), 857-885. https://doi.org/10.1017 / s0954579400004156
Mahalanobis, P. (1936). On the generalised distance in statistics. Sankhya A, 80(S1), 1-7. https://doi.org/10.1007/s13171-019-00164-5
Martínez, R., Moreno, R., Martin, I., & Trigo, M. (2009). Evaluation of five guidelines for option development in multiple-choice item-writing. Psicothema, 21(2), 326-330.
Mayunga, J. (2009). Measuring the Measure; a Multidimensional Scale Model to Measure Community Disaster Resilience in the U. S. Gulf Coast Region (Disertación doctoral, Texas A & M University). OAKTrust digital repository at Texas A & M. https://oaktrust.library.tamu.edu/handle/1969.1/ETD-TAMU-2009-05-769
McCaul, B. & Mitsidou, A. (2016). Análisis de la Resiliencia de las comunidades ante desastres. Caja de herramientas ARC-D. Manual de guía al usuario (2ª ed.). GOAL. http://resiliencenexus.org/wp-content/uploads/2020/05/ARC-DToolkitUserManualB01_SPANISH_Version_A03.pdf
McDonald, R. (2005). Semi confirmatory factor analysis: the example of anxiety and depression. Structural Equation Modeling: A Multidisciplinary Journal, 12(1), 163-172. https://doi.org/10.1207/s15328007sem1201_9
Merino-Soto, C. & Livia, J. (2009). Intervalos de confianza asimétricos para el índice la validez de contenido: Un programa Visual Basic para la V de Aiken. Anales de Psicología, 25(1), 169-171.
Merino-Soto, C. (2016). Percepción de la claridad de los ítems: comparación del juicio de estudiantes y jueces-expertos. Revista Latinoamericana de Ciencias Sociales, Niñez y Juventud, 14(2), 1469-1477. https://doi.org/10.11600/1692715x.14239120615
Merino-Soto, C. (2018). Confidence interval for difference between coefficients of content validity (Aiken's V): a SPSS syntax. Anales de Psicología, 34(3), 587-590. https://dx.doi.org/10.6018/analesps.34.3.283481
Miles, S. & Chang, S. (2008, 12-17 de octubre). Resil US: modeling community capital loss and recovery (Conferencia). The 14th World Conference on Earthquake Engineering, Beijing, China. http://www.iitk.ac.in/nicee/wcee/article/14_09-01-0095.PDF
Orencio, P. & Fujii, M. (2013). A localized disaster-resilience index to assess coastal communities based on an analytic hierarchy process (AHP). International Journal Disaster Risk Reduction, 3, 62-75. http://dx.doi.org/10.1016/j.ijdrr.2012.11.006
Parsons, M., Morley, P., Marshall, G., Hastings, P., Stayner, R., & Mcneill, J. (2016). The Australian Natural Disaster Conceptual Framework and Indicator Approach. Bushfire and Natural Hazards Cooperative Research Centre University of New England. http://www.preventionweb.net/publications/view/49081
Peacock, W., Merrell, A., Zahran S., Harriss, R., & Stickney, R. (2010). Advancing the Resilience of Coastal Localities: Developing, implementing and sustaining the uses of Coastal Resilience Indicator: A final report. Hazard Reduction and Recovery Centre. https://www.researchgate.net/profile/Walter-Peacock/publication/254862206_Final_Report_Advancing_the_Resilience_of_Coastal_Localities_10-02R/links/00b7d51feb3e3d0d4a000000/Final-Report-Advancing-the-Resilience-of-Coastal-Localities-10-02R.pdf
Pfefferbaum, R., Pfefferbaum, B., Horn, R., Klomp, R., Norris, F., & Reissman, D. (2013). The Communities Advancing Resilience Toolkit (CART): An Intervention to build Community Resilience to Disaster. Journal of public health management and practice, 19(3), 250-258. https://doi.org/10.1097/PHH.0b013e318268aed8
Raiche, G. & Magis, D. (2020). nFactors: parallel analysis and other non-graphical solutions to the Cattell Scree Test. R package version 2.4.1. https://CRAN.R-project.org/package=nFactors
Renschler, C., Frazier, A., Arendt, L., Cimellaro, G., & Bruneau, M. (2010). A Framework for Defining and Measuring Resilience at the Community Scale. The PEOPLES resilience framework (Technical Report MCEER-10-0006). University at Buffalo. https://www.eng.buffalo.edu/mceer-reports/10/10-0006.pdf
Revelle, W. (2019). Psych: Procedures for personality and psychological research (Archivo). Northwestern University, Illinois, Estados Unidos. https://CRAN.R-project.org/package=psych.
Shaw, R. (2009). Climate disaster resilience: focus on coastal urban cities in Asia. International Environment and Disasters Management, 1, 1-15.
Sherrieb, K., Norris, F., & Galea, S. (2010). Measuring capacities for community resilience. Social Indicator Research, 99, 227-247. https://doi.org/10.1007/s11205-010-9576-9
Singh, G. & Kaur, G. H. (2018) Moderating effect of resilience on role stress: a critical review. ZENITH International Journal of Multidisciplinary Research, 8(1), 114-122.
Suárez-Ojeda, E. (2001). Una concepción Latinoamérica: La Resiliencia Comunitaria. En A. Melillo (Ed.), Resiliencia. Descubriendo las propias fortalezas (pp.67-82). Paidós.
Summers, K., Harwell, L., Smith, L., & Buck, K. (2018). Measuring Community Resilience to Natural Hazards: The Natural Hazard Resilience Screening Index (NaHRSI)-Development and Application to the United States. Geohealth, 2(12), 372-394. https://doi.org/10.1029/2018GH000160
Twigg, J. (2007). Características de una comunidad Resiliente ante los desastres, una nota guía. https://www.eird.org/newsroom/Spanish_Characteristics_disaster_high_res.pdf
United Nations Development Program. (2013). Community Based Resilience Assessment (CoBRA) Conceptual Framework and Methodology.
United Nations Office for Disaster Risk Reduction. (2007). Hyogo Framework for Action 2005-2015: Building the resilience of nations and communities to disasters. https://www.undrr.org/publication/hyogo-framework-action-2005-2015-building-resilience-nations-and-communities-disasters
United Nations Office for Disaster Risk Reduction. (2020). Human cost of Disaster, An overview of the last 20 years 2000-2019. The United Nations Office for Disaster Risk Reduction. https://www. CRED-Disaster-Report-Human-Cost2000-2019.pdf
Verrucci, E., Rossetto, T., Twigg, J., & Adams, B. J. (2012, septiembre). Multi-disciplinary indicators for evaluating the seismic resilience of urban areas (Conferencia). Proceedings of 15th world conference earthquake engineering, Lisboa, Portugal. https://www.iitk.ac.in/nicee/wcee/article/WCEE2012_3490.pdf
Yoon, D., Kang, J., & Brody, S. D. (2015). A Measurement of Community Disaster Resilience in Korea, Journal of Environmental Planning and Management, 59(3), 436-460. https://doi.org/10.1080/09640568.2015.1016142
Zurich Flood Resilience Alliance. (2019). La medición de la Resiliencia de las Comunidades ante las Inundaciones (FRMC). https://infoinundaciones.com/medicion-de-la-resiliencia-comunitaria-ante-inundaciones/
Cómo citar: Suárez Ramos, V., López Vázquez, E., & Merino Soto, C. (2022). Construcción y validación de una Escala de Resiliencia Comunitaria Frente a Amenazas Naturales. Ciencias Psicológicas, 16(2), e-2723. https://doi.org/10.22235/cp.v16i2.2723
Contribución de los autores: a) Concepción y diseño del trabajo; b) Adquisición de datos; c) Análisis e interpretación de datos; d) Redacción del manuscrito; e) revisión crítica del manuscrito.
V. S. R. ha contribuido con a, b, c, d; E. L. V. con a, d, e; C. M. S. con c, d, e.
Editora científica responsable: Dra. Cecilia Cracco.
Ciencias Psicológicas v16n2
julio-diciembre 2025
10.22235/cp.v16i2.2723
Ciencias Psicológicas v16n2
July-December 2025
10.22235/cp.v16i2.2723
Original Article
Construction and validation of a Scale of Community Resilience Facing Natural Hazards
Construcción y validación de una Escala de Resiliencia Comunitaria Frente a Amenazas Naturales
Construção e validação de uma escala de resiliência comunitária ameaças naturais
Verónica Suárez Ramos1, ORCID 0000-0002-7932-5726
Esperanza López Vázquez2, ORCID 0000-0002-0401-8414
César Merino Soto3, ORCID 0000-0002-1407-8306
1 Universidad Autónoma del Estado de Morelos, Centro de Investigación Transdisciplinar en Psicología, Mexico, [email protected]
2 Universidad Autónoma del Estado de Morelos, Centro de Investigación Transdisciplinar en Psicología, Mexico
3 Universidad Autónoma del Estado de Morelos, Centro de Investigación Transdisciplinar en Psicología, Mexico
Abstract:
Background: The effects caused by natural phenomena have been increasing, aggravating the vulnerability of exposed populations. It is necessary to measure the resilience capacity of the community to face this type of adverse situations. The objective of the study was the construction and validation of a self-report scale of community resilience. Method: The items were based on the proposal of Twigg (2007) and Suárez-Ojeda (2001). The AIKEN V and semi-confirmatory analysis (McDonald, 2005) were used to validate the instrument. There was a sample of 290 participants with an age range of 18 to 78 years, from the municipalities of Jojutla and Yautepec in the State of Morelos (Mexico). Results: A final unidimensional scale made up of 16 items was obtained, internal consistency Ω = .924. Conclusions: This scale can be useful for those working in integrated disaster risk management.
Keywords: instrument validation; instrument construction; community resilience; risk management; natural hazards.
Resumen:
Antecedentes: Los efectos ocasionados por los fenómenos de origen natural han ido en aumento, agravando la vulnerabilidad de las poblaciones expuestas. Resulta necesario medir la capacidad de resiliencia de la comunidad para hacer frente a este tipo de situaciones adversas. El objetivo del estudio fue la construcción y validación de una escala de autoinforme de resiliencia comunitaria. Método: Los ítems se basaron en la propuesta de Twigg (2007) y Suárez-Ojeda (2001). Para la validación del instrumento se empleó la V de Aiken y el análisis semi-confirmatorio (McDonald, 2005). Se contó con una muestra de 290 participantes con un rango de edad de 18 a 78 años, de los municipios de Jojutla y Yautepec del Estado de Morelos (México). Resultados: Se obtuvo una escala final unidimensional conformada por 16 ítems, consistencia interna Ω = .924. Conclusiones: Esta escala puede ser de utilidad para quienes trabajan en la gestión integral de riesgos de desastres.
Palabras clave: validación de instrumentos; construcción de instrumentos; resiliencia comunitaria; gestión de riesgo; amenazas naturales.
Resumo:
Antecedentes: Os efeitos causados por fenômenos naturais vêm aumentando, agravando a vulnerabilidade das populações expostas. É necessário mensurar a capacidade de resiliência da comunidade para lidar com esse tipo de situação adversa. O objetivo do estudo foi a construção e a validação de uma escala de autorrelato de resiliência comunitária. Método: Os itens foram baseados na proposta de Twigg (2007) e Suárez-Ojeda (2001). Para validação do instrumento, utilizou-se o V do AIKEN e a análise semiconfirmatória (McDonald, 2005). A amostra foi de 290 participantes, com faixa etária de 18 a 78 anos, dos municípios de Jojutla e Yautepec do Estado de Morelos (México). Resultados: Obteve-se uma escala final unidimensional composta por 16 itens, consistência interna Ω = 0,924. Conclusões: Esta escala pode ser útil para quem trabalha na gestão integral do risco de desastres.
Palavras-chave: validação de instrumento; construção de instrumentos; resiliência comunitária; gerenciamento de riscos; ameaças naturais.
Received: 24/10/2021
Aceepted: 26/05/2022
Worldwide, the effects caused by hydro-meteorological and geological phenomena in the 20th and 21st centuries have caused economic losses of trillions of dollars; in the social aspect, 4.03 trillion dollars in goods and 1.23 million people were reported dead, as well as environmental damage (United Nations Office for Disaster Risk Reduction (UNDRR), 2020). The United Nations (UN) has emphasized in its strategy for disaster risk reduction, the urgency of promoting preparedness, prevention, mitigation, response, recovery, rehabilitation, reconstruction in the face of a crisis or disaster, and particularly community resilience (Diario Oficial de la Federación, 2014; UNDRR, 2007).
Resilience can be understood as the human capacity to cope with, overcome, and emerge strengthened and even transformed by adverse experiences (Grotberg, 2006). It is not static and is based on a dynamic ability that is adaptive to the situation which can also be considered as an adaptive response to a threat or risk (Singh & Kaur, 2018). Different studies have focused mainly on individual resilience (Bonanno, 2008; Davydov et al., 2010; Luthar & Cicchetti, 2000), but community resilience has started to take more space in the scientific landscape. Community resilience is understood as “the ability of communities and households to anticipate and adapt to risks and to absorb, respond to, and recover from shocks and stresses in a timely and effective manner” (Twigg, 2007, p. 6). It can also be understood as a resilient process from cultural knowledge, social capabilities, and organizational strategies in the face of adversity (López & Limón, 2017). Resilient characteristics are known as attributes or pillars of resilience within which, according to Suárez-Ojeda (2001), are collective self-esteem, cultural identity, social humor, state honesty, and solidarity. Other aspects that influence community resilience are well-being indicators, political, social, economic, physical (Almutairi et al., 2020,) and cultural aspects (De la Yncera, 2019; Lorenzo, 2016).
Population context
This instrument was validated in the state of Morelos, in the communities of Jojutla and Yautepec, which are exposed to natural phenomena of hydrometeorological and geological origin. Earthquakes are events that occur frequently in the Mexican territory; however, they do not occur with the same frequency in the state of Morelos. The earthquake that occurred on September 19, 2017, affected several municipalities in that state, including Jojutla, with two thousand houses affected and 55 people dead. In Yautepec, 870 houses were reported damaged, with no deaths (Diario Oficial de la Federación, 2017). Both municipalities have a high Human Development Index within the state, which allowed the populations to be compared.
Measurement of community resilience
A rapid systematic review was carried out (Haby et al., 2016), with the keywords community resilience scale, in the following search engines: Google Scholar, ELSEVIER, to find out if there was an instrument that could be adapted to the study of community resilience to risk situations of natural phenomena in the Mexican population. The results are shown in table 1.
Table 1: Generalizable aspects of index, tools and scales to measure community resilience
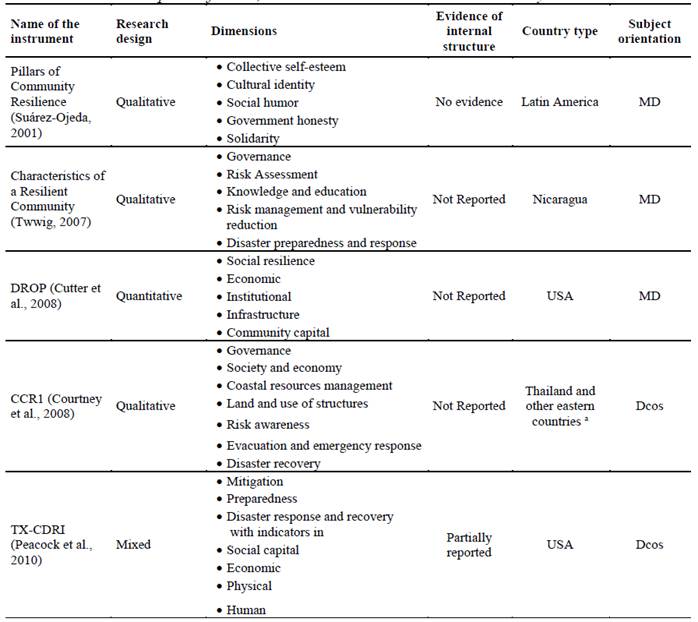
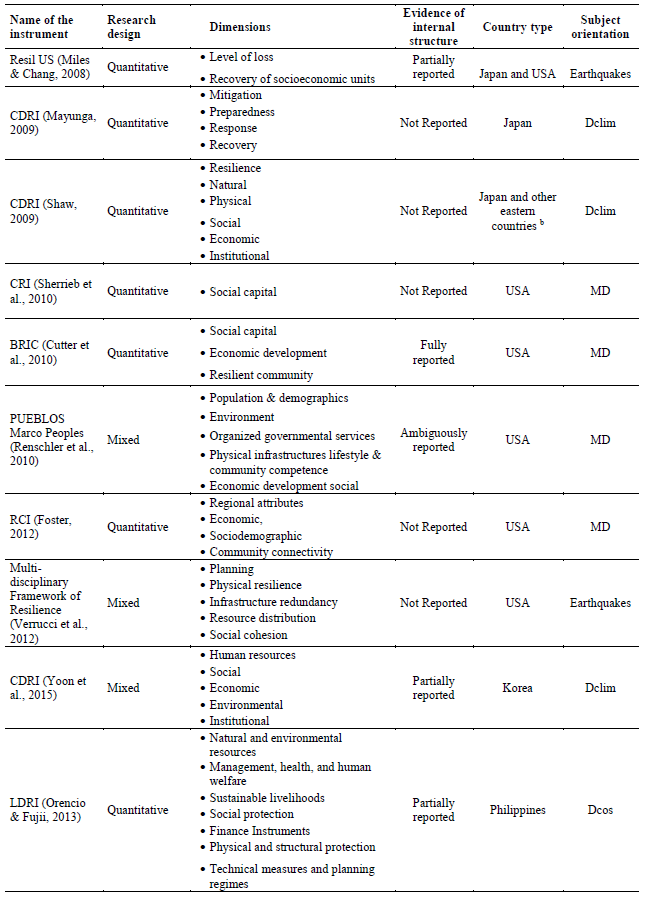
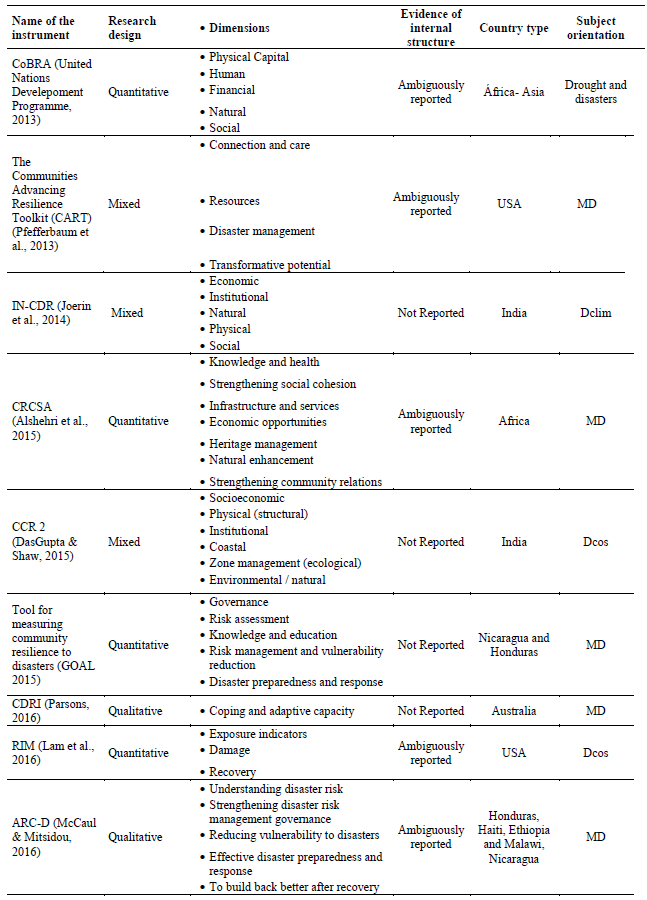
Note. MD: multi-disaster; DC: coastal disasters; DClim: climatic disasters. a Sri Lanka, Indonesia, India and Maldives. b Philippines, Vietnam, India, Indonesia, Thailand, Sri Lanka.
After an in-depth analysis of each of the proposals reviewed on the existing indexes and tools, a gap was observed in the instruments that would make it possible to incorporate into community resilience the risk aspects of natural hazards and the participation of both governmental bodies as well as existing community resources. Based on this, it was considered that Twigg's (2007) theoretical proposal provided the basis for the construction of a comprehensive instrument for the aspects of community resilience in disaster risk situations, which could also be completed with Suárez-Ojeda's (2001) proposal that includes dimensions of social support, solidarity, and social humor. In addition, both authors conducted resilience studies on the Central American population, which shares characteristics with the Mexican population, such as the economy and a history of natural disasters.
Based on the theoretical review of Twigg (2007) and Suárez-Ojeda (2001), the conceptual definitions of the dimensions were chosen as follows: a) Governance: concerning public policies in charge of planning, regulation and integration of institutional systems, alliances between various civil society organizations and community participation; b) Knowledge and education: identifies the information that the population has regarding hazard-risk, vulnerability and impact, as well as the scientific and technical capacities to deal with them; c) Risk management and vulnerability reduction: management of the environment and natural resources, health and welfare of communities, social security through financial instruments, physical protection and technical and structural measures, as well as the implementation of planning systems that seek to reduce vulnerability; d) Disaster preparedness and response: to know the organizational capacity to respond to a natural phenomenon, through early warning systems, preparation and contingency planning, enabling resources and infrastructure to respond to emergencies, as well as establishing protocols for emergency response and recovery with the participation of the government and civil society; e) Social support and solidarity, is the capacity to collaborate with others who require support to move forward, who are part of the community and whose purpose is the search for the common benefit; f) Community coping, is the particular way in which each group faces the adverse situations to which it is exposed: g) Social humor, is the ability to laugh despite the negative things, which are happening in the environment and looking for an optimistic solution to get out of it; h) Trust in regulatory agencies, is the good use of existing resources and managed for the community by local and federal authorities for risk management.
Considering the gap in measurement tools on community resilience in situations of natural hazards, this study developed an instrument inspired by the contributions of two authors. The theoretical dimensions chosen, and the evidence of content validity and internal structure are presented below.
Material and methods
Participants
The sample was selected on a non-probabilistic basis and was formed under the following inclusion criteria: a) having experienced at some point in their lives the effects of a natural disaster (earthquake and/or flood), b) being of legal age, c) having freely approved their participation, d) being a member and resident of these communities. The post-data collection exclusion criteria were unanswered items (missing values) and the identification of multivariate extreme values (outliers).
The selected sample, based on non-probabilistic sampling, consisted of inhabitants of Jojutla (n = 263, 91 %) and Yautepec (n = 27, 9 %), with a total of 290 participants, 55.7 % women and 44.3 % men with an age range of 18 to 79 years (M = 29.4, SD = 14.5). Regarding educational level, 27.9 % had basic education, 39.7 % had high school, 30.2 % had a bachelor's degree, 0.7 % had a graduate degree, and 1.4 % had no studies.
Instrument
In the elaboration of the situations that promote community resilience we relied on the theoretical components proposed by Twigg (2007) and Suárez-Ojeda (2001), considering the eight dimensions explained above.
Procedure
Dimensionality. The instrument was represented by eight dimensions based on the 5 theoretical dimensions proposed by Twigg (2007) and the 3 proposed by Suárez-Ojeda (2001), with correlated expectations. The definitions were elaborated considering their conceptual applicability to the context of the chosen Mexican communities and their potential for generalization to other Latin American contexts, their approximate convergence with other definitions in the literature, their potential to be represented in the content of the items (Delgado-Rico et al., 2012).
Item development. To write the items, the existing literature was reviewed, determining the theoretical model and the operational definition of the dimensions that would make up the instrument. Subsequently, the items were written in the first person, taking care to use clear, homogeneous language in accordance with the proposed dimensions.
As a guideline for response options, a 5-point Likert scale was proposed to give as possible responses the degree of disagreement-agreement, in relation to the items elaborated. A homogeneous length was sought in terms of content and appearance, preventing items from overlapping each other (Martínez et al., 2009). Initially, 27 items were proposed, distributed in 8 theoretical dimensions as shown in table 2.
Table 2: Conceptual operationalization and distribution of items of the instrument
Expert judges. Once the instrument proposal was integrated, the expert judgment technique was used to submit the questions to the scrutiny of experts in the field, to determine how relevant, the questions of the scale were in relation to the proposed topic (Escobar-Pérez & Cuervo-Martínez, 2008). The group of judges consisted of five psychologists chosen for their verifiable expertise through their publications and field experience in their areas of work in relation to the topic: two full-time academics at universities in Mexico and Chile, and three disaster psychologists who have been part of the Mexican and International Red Cross and the Psychological Attention for Disasters (APSIDE) program. Each was contacted individually and sent a form explaining the instructions for evaluating the content of the items on the criteria of coherence (defined as that the item has a logical relationship with the dimension or indicator being measured), relevance (defined as that the item is essential or important, so it should be included) and clarity (defined as that the item is easily understood, i.e., it has adequate syntax and semantics). They were also asked to make observations and suggestions according to their consideration. Each judge made his or her contributions independently of the other judges. The judges' responses were analyzed by means of Aiken's V coefficient (Aiken, 1985) to see the degree of agreement among the experts in terms of clarity, relevance and coherence. The ICAiken program (Merino-Soto & Livia, 2009) was used.
Participating judges. Because there may be possible discrepancies in the perception of the conceptual relevance and clarity of the items perceived by judges and participants (Merino-Soto, 2016; 2018). A pilot application was carried out to 33 people from one of the communities to be studied, with an age range of 18 to 70 years (M = 34.94; SD = 17.97), of which 60.6 % were men and 39.4 % were women. During the application, the participating judges made observations on the instrument, regarding words that for them had a different meaning or that were not clear and caused confusion in their answers.
Regarding the proposed dimensions, they were unable to differentiate between the dimensions of community support and coping; they considered that they belonged to the same dimension. The humor dimension was not clear to them, and they did not consider it important.
Data cleaning. Data cleaning began with the identification of a) the number of unanswered items in the instrument, and b) multivariate extreme values. The first was done with a simple count of the unanswered items; the second was done by applying the D2 statistic (Mahalanobis, 1936), which obtains the multivariate distance of the data from the centroid response of the variables. The program norm (DeCarlo, 1997) was used. For descriptive statistics, and univariate (Cramér-von-Mises test, CVM; Darling, 1957) and multivariate normality (HZ test; Henze & Zirkler, 1990), the MVN program (Korkmaz, et al., 2014) was used.
Dimensionality. The analysis of the internal structure of the instrument consisted of a combination of exploratory and confirmatory approaches to establish the structure of the instrument. The exploratory approach was applied to verify the number of latent dimensions underlying the data, and to identify the existence of possible redundant dimensions. The number of dimensions proposed for the instrument was six, which served as a hypothesis of dimensionality. A consensus approach (Lüdecke et al., 2020) was used among several dimensionality identification methods, using the programs nFactors (Raiche & Magis, 2020) and psych (Revelle, 2019), integrated into the parameters program (Lüdecke et al., 2020). This approach consists in the maximum convergence of 24 methods regarding the number of possible dimensions.
Internal structure of the items. In the next step, a semi-confirmatory factor analysis was applied (McDonald, 2005). Although in the exploratory stage unidimensionality was suggested as the recommended internal structure, the semi-confirmatory factor analysis was applied to observe the congruence of the items with their factors and the degree of factorial complexity. The Factor 10.10 program (Lorenzo-Seva & Ferrando, 2006) was used, applied to the polychoric correlations between items. To evaluate the congruence between the items with their expected relationship to the factors, the congruence coefficient (Burt, 1948) was used; values greater than 0.90 indicate good congruence (Lorenzo-Seva & Ten Berge, 2006), so we proceeded to review the items that met the congruence index, accepting 16 of these and although unidimensionality was suggested, in the final scale we considered that at least two items from each of the theoretical dimensions should be included.
Data analysis
Expert judges. All expert judges invited to evaluate the items completed the task. Of the 27 items evaluated, only 1 item was considered to have insufficient content validity (clarity, coherence and relevance < .87) and was therefore eliminated. Improvements were made to the wording of 3 items and 1 item was added. Table 3 shows the results obtained with the Aiken V for clarity, coherence and relevance.
Table 3: Degree of agreement among the judges in relation to clarity, coherence and relevance
Note. V: AIKEN V Validity Coefficient.
Participating judges. All the participating judges completed the task. They reported that they did not associate the word "disappeared" with the topic of natural disasters but related it to situations of violence and organized crime. Likewise, the questions on the dimensions of humor, community coping, community support and solidarity were not considered relevant, caused them confusion and they mentioned that they were similar.
Subsequently, with the judges' observations and suggestions, it was decided to merge the dimensions of community coping and community support and solidarity into a single theoretical dimension since the wording and content of these dimensions were very similar and their separation only confused the reader. Then, the questions related to the use of humor as a way of coping with danger were eliminated as they were evaluated as irrelevant. At the judges' suggestion, four more items were added to the knowledge and response readiness dimensions, so that the scale for validation consisted of 24 items.
Preliminary analysis. Three cases (1 %) with no response to the items were detected, 2 (6 %) were imputed by the modal value of the item. Regarding the multivariate extreme values, by means of the Mahalanobis distance, 10 participants were detected and eliminated, representing 3.3 % of the sample.
Descriptive analysis of items. The descriptive results of the items are presented. The set of items did not show multivariate normality (Henze-Zirkler test = 1.211, p < .01); this was derived from the absence of univariate normality in each item (Cramer-von Mises test, CVM < .01). On the other hand, there seems to be no restriction in the response range, because the participants used the entire range of options. This similarity in the use of scaling was also observed in the dispersion (standard deviation) of each item as shown in table 4.
Table 4: Descriptive statistics for the Community Resilience Scale items (n = 290)
Notes. ERC: community resilience scale; CVM: Cramer von Mises univariate normality; As: skewness coefficient; Cu: coefficient of kurtosis.
*p < .05.
Dimensionality. The empirical eigenvalues obtained from the inter-item correlation matrix were as follows (top seven): 10.379, 1.627, 1.105, 1.031, .988, .906, .797. With the application of the consensus approach it was found that a single dimension was suggested by 21.7% of methods based on the hillside plot or scree test (e.g., acceleration factor and multiple regression), VSS (method 2), and model fitting (e.g., TLI and RMSEA coefficients); two factors (8.6 %) by VSS (method 1) and MAP-Velicer; three factors (13.0 %) by CNG, BIC-information and BIC-fitting; 4 factors (21.7 %) by methods predominantly based on the slope graph. Due to the parsimony in the construct representation of the instrument, the difference between the first eigenvalue compared to the rest of the eigenvalues, and that the eigenvalues from the second were comparatively very small with respect to the first, the apparent number of factors suggested for the measurement model was a single dimension.
To examine and verify the apparent strong latent unidimensionality of the instrument items, the factor loadings of the 24 items are shown in table 5. There are items that load on more than one factor, and the correlations between dimensions are considered high, so it was decided to perform a semi-confirmatory analysis.
Table 5: Factor loadings per ítem
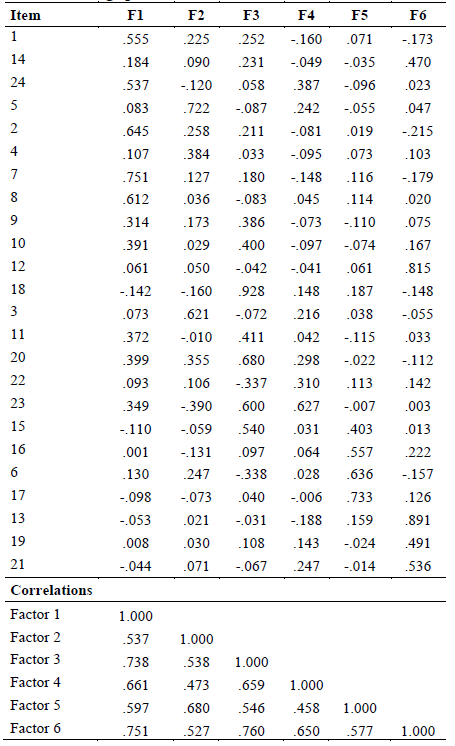
Table 6 shows the level of congruence with the unidimensionality and the factor loadings, where those that had an I-Unique and I-ECV = or < .95 were considered to be part of the final instrument, forming a unidimensional scale with 16 items that will allow the general measurement of Community Resilience in populations of the state of Morelos that have been exposed to earthquakes and floods.
Table 6: Level of congruence of unidimensionality
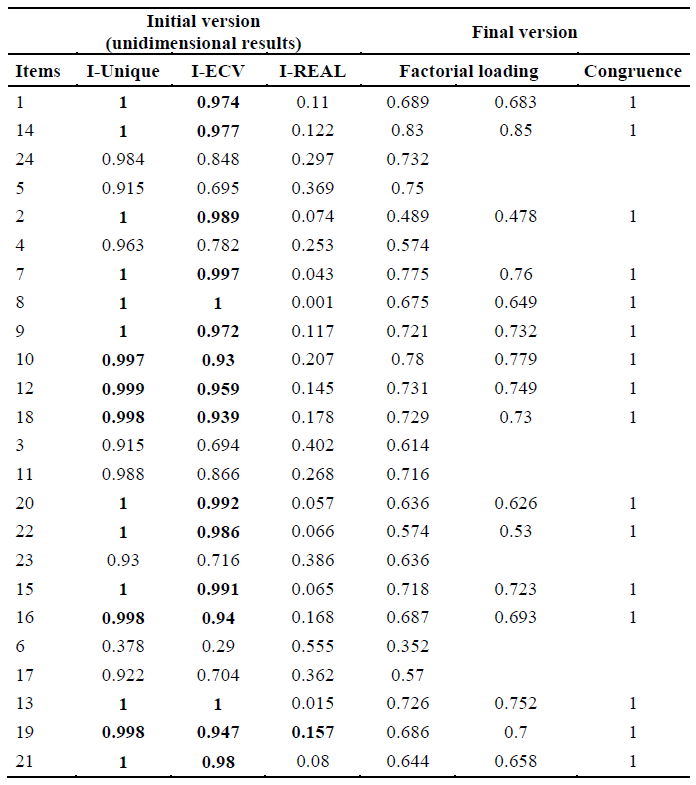
Also, the 16 items that made up the final instrument, with factor loadings between .478 and .850 (M = .693; Md = .711) are shown in bold. The reliability coefficient Ω was .924. Therefore, it is considered to meet very high values of reliability and internal structure validity.
Discussion
This study presents a scale of Community Resilience for the Mexican population that allows for a general measurement of actions such as risk prevention, preparedness, governance, as well as trust in the authorities in the face of risk situations in a global manner without differentiating between the dimensions initially proposed.
The ways of approaching the analysis of community resilience are complex because they involve the management of social aspects that are intertwined and that cannot always be differentiated in a practical way. It is also necessary to consider the issues to be addressed. A recent study shows the importance of considering, in the study of community resilience, the local problems that affect a community. In such a way that dimensions are structured in this sense (economy, infrastructure, governance, institutions, etc.); for example, in the case of coastal communities, the prevailing themes are social and economic to assess community resilience. However, the frames of reference vary depending on what is sought in each research, as the themes can be very broad (Almutairi et al., 2020). This shows us the complexity of establishing the parameters that should contain the dimensions to be measured when talking about community resilience.
A recent study in North America proposed a scale of resilience to natural hazards, economic shocks and other challenges, aimed at analyzing the progress of perceived community resilience and assessing the contribution of predictors of resilience. However, the authors note that measures of community resilience are potentially combined with predictors and indicators of resilience, resulting in a unidimensional scale that allows measurement based on overall community resilience (Lindberg & Swearing, 2020). We could think that a similar situation is presented in our case since the different theoretical dimensions that were proposed failed to discriminate a difference between them making our instrument a unidimensional scale of community resilience. Despite this situation, our scale meets all the criteria of reliability and validity and therefore offers a way to measure this type of resilience in the face of chronic natural hazards in the Mexican population.
The scale could be validated in other Latin American countries since the theoretical dimensions arose from themes proposed in studies carried out in Latin America. Another particularity of our scale also lies in the fact that it is oriented to measure community resilience from the components of integrated risk management in which both actions of the population and regulatory agencies are involved, obtaining a global indicator of resilience in this issue in the Mexican population.
Conclusions
It is important to point out that the concept of community resilience is a term that, as its name indicates, is developed within the community, considering its own intrinsic and extrinsic characteristics, so it is important to have instruments that take into account the cultural, social and geographic differences of the populations in order to promote resilience actions according to the needs of the community and the exposed risks. Among the limitations of the scale is the fact that it has not been validated in a larger sample. This proposal may be useful for those working in integrated disaster risk management, as it is important to consider the vision of the populations involved in natural hazards.
References:
Aiken, L. R. (1985). Three coefficients for analyzing the reliability and validity of ratings. Educational and Psychological Measurement, 45, 131-142. https://doi.org/10.1177/0013164485451012
Almutairi, A., Mourshed, M. & Mohammed, R. (2020). Coastal community resilience frameworks for disaster risk management. Natural Hazards: Journal of the International Society for the Prevention and Mitigation of Natural, 101(2), 595-630. https://doi.org/10.1007/s11069-020-03875-3
Alshehri, S., Rezgui, Y., & Li, H. (2015). Disaster community resilience assessment method: a consensus-based Delphi and AHP approach. Natural Hazards: Journal of the International Society for the Prevention and Mitigation of Natural, 78, 395-416. https://doi.org/10.1007/s11069-015-1719-5
Bonanno, G. (2008). Loss, Trauma, and Human Resilience: Have We Underestimated the Human Capacity to Thrive After Extremely Aversive Events? Psychological Trauma: Theory, Research, Practice, and Policy, 1, 101-113. https://doi.org/10.1037/0003-066X.59.1.20
Burt, C. (1948). The factorial study of temperament traits. British Journal of Psychology, Statistical Section, 1, 178-203. https://doi.org/10.1111/j.2044-8317.1948.tb00236.x
Courtney, C., Ahmed, A., Jackson, R., McKinnie, D., Rubinoff, P., Stein, A., Tighe, S., & White, A. (2008). Coastal Community Resilience in the Indian Ocean Region: Unifying framework, assessment and lessons learned. Solutions to Coastal Disasters 2008. https://doi.org/10.1061/40968(312)88
Cui, K. & Han, Z. (2019). Cross-Cultural Adaptation and Validation of the 10-Item Conjoint Community Resiliency Assessment Measurement in a Community-Based Sample in Southwest China. International Journal of Disaster Risk Science 10, 439-448. https://doi.org/10.1007/s13753-019-00240-2
Cutter, S., Barnes, L., Berry, M., Burton, C., Evans, E. & Tate, E. (2008). A place-based model for understanding community resilience to natural disasters. Global Environmental Change, 18, 598-606.
Cutter, S., Burton, C., & Emrich, T. (2010). Disaster resilience indicators for benchmarking baseline conditions. Journal of Homeland, Security and Emergency Management, 7, 1-22. http://dx.doi. org/10.2202/1547-7355.1732
Darling, D. (1957). The Kolmogorov-Smirnov, Cramer-von Mises Tests. Annals of Mathematic Statistic, 28(4), 823-838. https://doi.org/10.1214/aoms/1177706788
DasGupta, R. & Shaw, R. (2015). An indicator-based approach to assess coastal communities’ resilience against climate related disasters in Indian Sundarbans. Journal Coast Conservation 19, 85-101. http://dx.doi. org/10.1007/s11852-014-0369-1
Davydov, D., Stewart, R., Ritchie, K. & Chaudieu, I. (2010). Resilience and mental Health. Clinical Psychology Review, 30(5), pp. 479-495.
De la Yncera, N. de la C. (2019). Resiliencia comunitaria frente al riesgo de desastre de origen natural en Yautepec, Morelos (Doctoral dissertation, Universidad Autónoma del Estado de Morelos). Repositorio Institucional de Acceso Abierto (RIAA) de la Universidad Autónoma del Estado de Morelos. http://riaa.uaem.mx/xmlui/handle/20.500.12055/792
DeCarlo, L. (1997). On the meaning and use of kurtosis. Psychological Methods, 2(3), 292-307. https://doi.org/10.1037/1082-989X.2.3.292
Delgado-Rico, E., Carretero-Dios, H., & Willbald, R. (2012). Content validity evidences in test development: An applied perspective. International Journal of Clinical and Health Psychology, 12(3), 449-459.
Diario Oficial de la Federación. (2014, May 13). Reglamento de la ley General de Protección Civil. https://www.dof.gob.mx/nota_detalle.php?codigo=5344324&fecha=13/05/2014
Diario Oficial de la Federación. (2017, September 28). Declaratoria de Desastre Natural por la ocurrencia de sismo con magnitud 7.1 ocurrido el 19 de septiembre de 2017, en 33 municipios del estado de Morelos. http://www.dof.gob.mx/nota_detalle.php?codigo=5499058&fecha=28/09/2017
Escobar-Pérez, J. & Cuervo-Martínez, A. (2008). Validez de contenido y juicio de expertos: una aproximación a su utilización. Avances de Medición, 6, 27-36.
Foster, K. (2012). Resilience Capacity Index. Univ. California Berekley. http://bangportal.com/wp-content/uploads/2017/06/Resilience-Capacity-Index.pdf
GOAL. (2015). Herramienta para medir la resiliencia comunitaria ante desastres. Guía metodológica. https://dipecholac.net/docs/herramientas-proyecto-dipecho/honduras/Guia-Medicion-de-Resiliencia.pdf
Grotberg, E. (2006). ¿Qué entendemos por resiliencia? ¿Cómo promoverla? ¿Cómo utilizarla? In E. Grotberg (Ed.), La resiliencia en el mundo de hoy. Cómo superar las adversidades (pp. 17-57). Gedisa.
Haby, M., Chapman, E., Clark, R., Barreto, J., Reviez, L., & Lavis, J. (2016). What are the best methodologies for rapid reviews of the research evidence for evidence-informed decision making in health policy and practice: a rapid review. Health Research Policy and Systems, 14(83), 1-12. https://doi.org/10.1186/s12961-016-0155-7
Henze, N. & Zirkler, B. (1990). A class of invariant consistent tests for multivariate normality. Communications in Statistics – Theory and Methods, 19(10), 3595-3618. https://doi.org/10.1080/03610929008830400
Joerin, J., Shaw, R., Takeuchi, Y., & Krishnamurthy, R. (2014). The adoption of a Climate Disaster Resilience Index in Chennai, India. Desastres, 38, 540-561. https://doi.org/10.1111/disa.12058
Korkmaz, S., Goksuluk, D., & Zararsiz, G. (2014). MVN: An R package for assessing multivariate normality. The R Journal, 6(2), 151-162.
Lam, N., Reams, M., Li, K., Li, C., & Mata, L. (2016). Measuring Community Resilience to Coastal Hazards along the Northern Gulf of Mexico. Natural Hazards: Journal of the International Society for the Prevention and Mitigation of Natural, 17(1), 04015013. https://doi.org/10.1061/(ASCE)NH.1527-6996.0000193
Lindberg, K. & Swearing, T. (2020). A Reflective Thrive‐Oriented Community Resilience Scale. American Journal of Community Psychology, 65(3-4), 467-478. https://doi.org/10.1002/ajcp.12416
López, F. & Limón, F. (2017) Componentes del proceso de resiliencia comunitaria: conocimientos culturales, capacidades sociales y estrategias organizativas. PSIENCIA. Revista Latinoamericana de Ciencia Psicológica. 9(3), 1-13.
Lorenzo, A. (2016, November 7-11). El entrenamiento histórico cultural como verdadero potenciador de la readaptación psicosocial para la promoción de salud y bienestar en el Caribe a comunidades damnificadas por desastres (Conference presentation). Caribbean Regional Conference of Psychology 2016, Port au Prince, Haiti.
Lorenzo-Seva, U. & Ferrando, P. (2006). Factor 10.10. (Free software). Departamento de Psicología Universitat Rovira I Virgili. https://psico.fcep.urv.cat/utilitats/factor/Download.html
Lorenzo-Seva, U. & Ten Berge, J. (2006). Tucker's congruence coefficient as a meaningful index of factor similarity. Methodology, 2, 57-64. https://doi.org/10.1027/1614-2241.2.2.57
Lüdecke, D., Ben-Shachar, M. S., & Makowski, D. (2020). Describe and understand your model’s parameters. CRAN. https://easystats.github.io/parameters. 10.5281/zenodo.3731932
Luthar, S. & Cicchetti, D. (2000). The construct of resilience: implications for interventions and social policies. Development & Psychopathology, 12(4), 857-885. https://doi.org/10.1017 / s0954579400004156
Mahalanobis, P. (1936). On the generalised distance in statistics. Sankhya A, 80(S1), 1-7. https://doi.org/10.1007/s13171-019-00164-5
Martínez, R., Moreno, R., Martin, I., & Trigo, M. (2009). Evaluation of five guidelines for option development in multiple-choice item-writing. Psicothema, 21(2), 326-330.
Mayunga, J. (2009). Measuring the Measure; a Multidimensional Scale Model to Measure Community Disaster Resilience in the U. S. Gulf Coast Region (Doctoral dissertation, Texas A & M University). OAKTrust digital repository at Texas A & M. https://oaktrust.library.tamu.edu/handle/1969.1/ETD-TAMU-2009-05-769
McCaul, B. & Mitsidou, A. (2016). Análisis de la Resiliencia de las comunidades ante desastres. Caja de herramientas ARC-D. Manual de guía al usuario (2nd ed.). GOAL. http://resiliencenexus.org/wp-content/uploads/2020/05/ARC-DToolkitUserManualB01_SPANISH_Version_A03.pdf
McDonald, R. (2005). Semi confirmatory factor analysis: the example of anxiety and depression. Structural Equation Modeling: A Multidisciplinary Journal, 12(1), 163-172. https://doi.org/10.1207/s15328007sem1201_9
Merino-Soto, C. & Livia, J. (2009). Intervalos de confianza asimétricos para el índice la validez de contenido: Un programa Visual Basic para la V de Aiken. Anales de Psicología, 25(1), 169-171.
Merino-Soto, C. (2016). Percepción de la claridad de los ítems: comparación del juicio de estudiantes y jueces-expertos. Revista Latinoamericana de Ciencias Sociales, Niñez y Juventud, 14(2), 1469-1477. https://doi.org/10.11600/1692715x.14239120615
Merino-Soto, C. (2018). Confidence interval for difference between coefficients of content validity (Aiken's V): a SPSS syntax. Anales de Psicología, 34(3), 587-590. https://dx.doi.org/10.6018/analesps.34.3.283481
Miles, S. & Chang, S. (2008, October 12-17). Resil US: modeling community capital loss and recovery (Conference presentation). The 14th World Conference on Earthquake Engineering, Beijing, China. http://www.iitk.ac.in/nicee/wcee/article/14_09-01-0095.PDF
Orencio, P. & Fujii, M. (2013). A localized disaster-resilience index to assess coastal communities based on an analytic hierarchy process (AHP). International Journal Disaster Risk Reduction, 3, 62-75. http://dx.doi.org/10.1016/j.ijdrr.2012.11.006
Parsons, M., Morley, P., Marshall, G., Hastings, P., Stayner, R., & Mcneill, J. (2016). The Australian Natural Disaster Conceptual Framework and Indicator Approach. Bushfire and Natural Hazards Cooperative Research Centre University of New England. http://www.preventionweb.net/publications/view/49081
Peacock, W., Merrell, A., Zahran S., Harriss, R., & Stickney, R. (2010). Advancing the Resilience of Coastal Localities: Developing, implementing and sustaining the uses of Coastal Resilience Indicator: A final report. Hazard Reduction and Recovery Centre. https://www.researchgate.net/profile/Walter-Peacock/publication/254862206_Final_Report_Advancing_the_Resilience_of_Coastal_Localities_10-02R/links/00b7d51feb3e3d0d4a000000/Final-Report-Advancing-the-Resilience-of-Coastal-Localities-10-02R.pdf
Pfefferbaum, R., Pfefferbaum, B., Horn, R., Klomp, R., Norris, F., & Reissman, D. (2013). The Communities Advancing Resilience Toolkit (CART): An Intervention to build Community Resilience to Disaster. Journal of public health management and practice, 19(3), 250-258. https://doi.org/10.1097/PHH.0b013e318268aed8
Raiche, G. & Magis, D. (2020). nFactors: parallel analysis and other non-graphical solutions to the Cattell Scree Test. R package version 2.4.1. https://CRAN.R-project.org/package=nFactors
Renschler, C., Frazier, A., Arendt, L., Cimellaro, G., & Bruneau, M. (2010). A Framework for Defining and Measuring Resilience at the Community Scale. The PEOPLES resilience framework (Technical Report MCEER-10-0006). University at Buffalo. https://www.eng.buffalo.edu/mceer-reports/10/10-0006.pdf
Revelle, W. (2019). Psych: Procedures for personality and psychological research (Archive). Northwestern University, Illinois, USA. https://CRAN.R-project.org/package=psych.
Shaw, R. (2009). Climate disaster resilience: focus on coastal urban cities in Asia. International Environment and Disasters Management, 1, 1-15.
Sherrieb, K., Norris, F., & Galea, S. (2010). Measuring capacities for community resilience. Social Indicator Research, 99, 227-247. https://doi.org/10.1007/s11205-010-9576-9
Singh, G. & Kaur, G. H. (2018) Moderating effect of resilience on role stress: a critical review. ZENITH International Journal of Multidisciplinary Research, 8(1), 114-122.
Suárez-Ojeda, E. (2001). Una concepción Latinoamérica: La Resiliencia Comunitaria. En A. Melillo (Ed.), Resiliencia. Descubriendo las propias fortalezas (pp.67-82). Paidós.
Summers, K., Harwell, L., Smith, L., & Buck, K. (2018). Measuring Community Resilience to Natural Hazards: The Natural Hazard Resilience Screening Index (NaHRSI)-Development and Application to the United States. Geohealth, 2(12), 372-394. https://doi.org/10.1029/2018GH000160
Twigg, J. (2007). Características de una comunidad Resiliente ante los desastres, una nota guía. https://www.eird.org/newsroom/Spanish_Characteristics_disaster_high_res.pdf
United Nations Development Program. (2013). Community Based Resilience Assessment (CoBRA) Conceptual Framework and Methodology.
United Nations Office for Disaster Risk Reduction. (2007). Hyogo Framework for Action 2005-2015: Building the resilience of nations and communities to disasters. https://www.undrr.org/publication/hyogo-framework-action-2005-2015-building-resilience-nations-and-communities-disasters
United Nations Office for Disaster Risk Reduction. (2020). Human cost of Disaster, An overview of the last 20 years 2000-2019. The United Nations Office for Disaster Risk Reduction. https://www. CRED-Disaster-Report-Human-Cost2000-2019.pdf
Verrucci, E., Rossetto, T., Twigg, J., & Adams, B. J. (2012, September). Multi-disciplinary indicators for evaluating the seismic resilience of urban areas (Conference presentation). Proceedings of 15th world conference earthquake engineering, Lisbon, Portugal. https://www.iitk.ac.in/nicee/wcee/article/WCEE2012_3490.pdf
Yoon, D., Kang, J., & Brody, S. D. (2015). A Measurement of Community Disaster Resilience in Korea, Journal of Environmental Planning and Management, 59(3), 436-460. https://doi.org/10.1080/09640568.2015.1016142
Zurich Flood Resilience Alliance. (2019). La medición de la Resiliencia de las Comunidades ante las Inundaciones (FRMC). https://infoinundaciones.com/medicion-de-la-resiliencia-comunitaria-ante-inundaciones/
How to cite: Suárez Ramos, V., López Vázquez, E., & Merino Soto, C. (2022). Construction and validation of a Scale of Community Resilience Facing Natural Hazards. Ciencias Psicológicas, 16(2), e-2723. https://doi.org/10.22235/cp.v16i2.2723
Authors’ participation: a) Conception and design of the work; b) Data acquisition; c) Analysis and interpretation of data; d) Writing of the manuscript; e) Critical review of the manuscript.
V. S. R. has contributed in a, b, c, d; E. L. V. in a, d, e; C. M. S. in c, d, e.
Scientific editor in charge: Dra. Cecilia Cracco.
Ciencias Psicológicas v16n2
July-December 2025
10.22235/cp.v16i2.2723